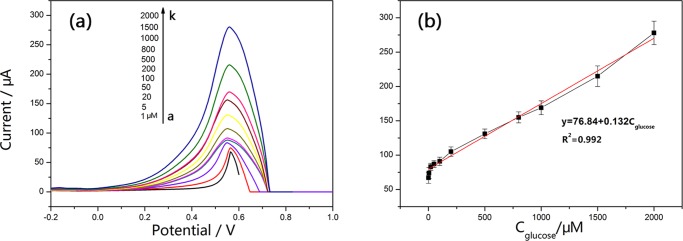
Figure 7.
(a) Differential pulse voltammogram responses of the graphene-encapsulated Cu composites in different concentrations (from a to k: 1, 5, 20, 50, 100, 200, 500, 800, 1000, 1500, and 2000 μM) of glucose in 0.1 M NaOH. (b) Linear relationship between the peak current and the analyte concentration.

