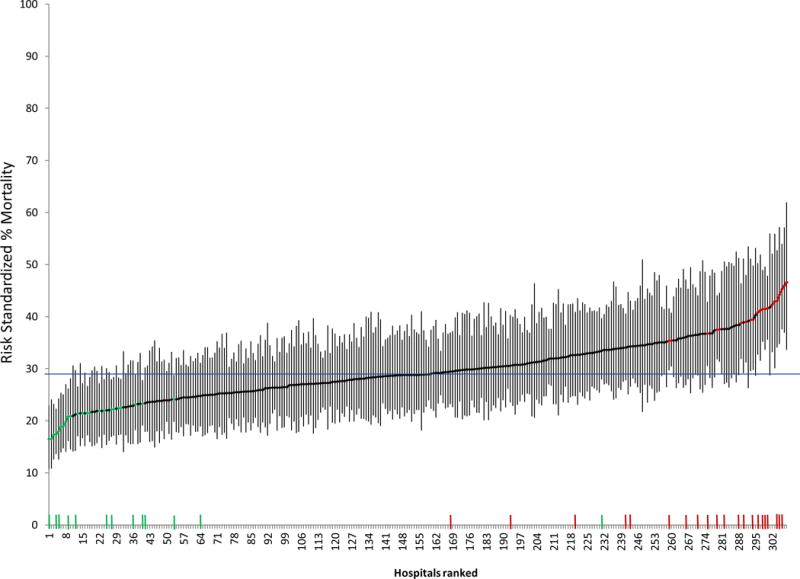
Figure 2.

Caterpillar plot of risk standardized hospital mortality rates for cohort of septic shock defined by charges for antibiotics/cultures/vasopressors (implicit diagnosis).
The horizontal line at 29% is the average mortality rate for the cohort. Points along the caterpillar plot colored green signify low mortality outlier hospitals and red points high mortality outliers. Tick marks along the x-axis demonstrate the hospitals identified as low mortality (green) and high mortality (red) outliers when patient cohorts were defined with ICD-9 criteria for septic shock.
