
Figure 1.
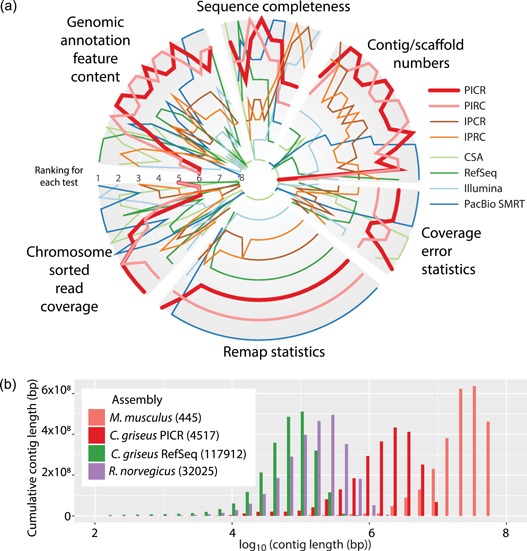
The PICR assembly ranked against other mammalian assemblies. (a) The PICR assembly was compared with other candidate assemblies of Cricetulus griseus based on 80 different assembly metrics. This shows for each test how the assemblies compare. The best assembly for each test is plotted on the outer rim, whereas the worst is near the center. Eighty tests were defined (see Supporting Information Table S3) in six different categories. On average, the PICR assembly was the most highly ranked, with the PIRC assembly closely following. (b) Weighted histogram of the contig lengths for the PICR assembly (red) compared with the Ensemble mouse (salmon), rat (purple), and the previous Chinese hamster RefSeq assemblies (green) [Color figure can be viewed at wileyonlinelibrary.com]