
Fig 3.
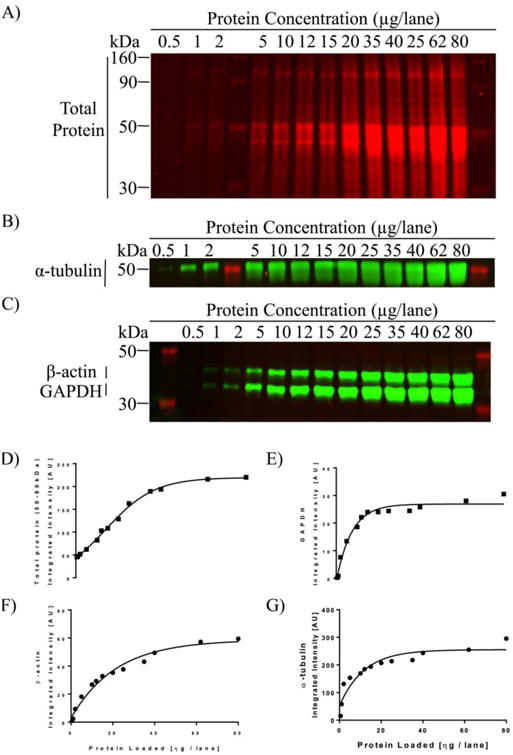
Analysis of linear range of detectability for TP and each HKP. Representative images of PVDF membranes stained with total-protein (A) and three HKPs (B,C) in a serial dilution of regional rat brain homogenates ranging from 0.5 μg to 80 μg per lane. (D-G) Graphs showing densitometric analysis. Lines show least-squares best fit across all points. For each curve, a dynamic range for quantification was defined by choosing the linear portion of the curve that yields the highest correlation. For example, note the rapid saturation of α-tubulin signal at 25μg/lane and the limited linear range of GAPDH (5 to 15 μg/lane) and P-actin (5 to 25 μg/lane). In contrast, REVERT® TP signal had a much wider linear range (0.5 to 40 μg/lane).