
Figure 4.
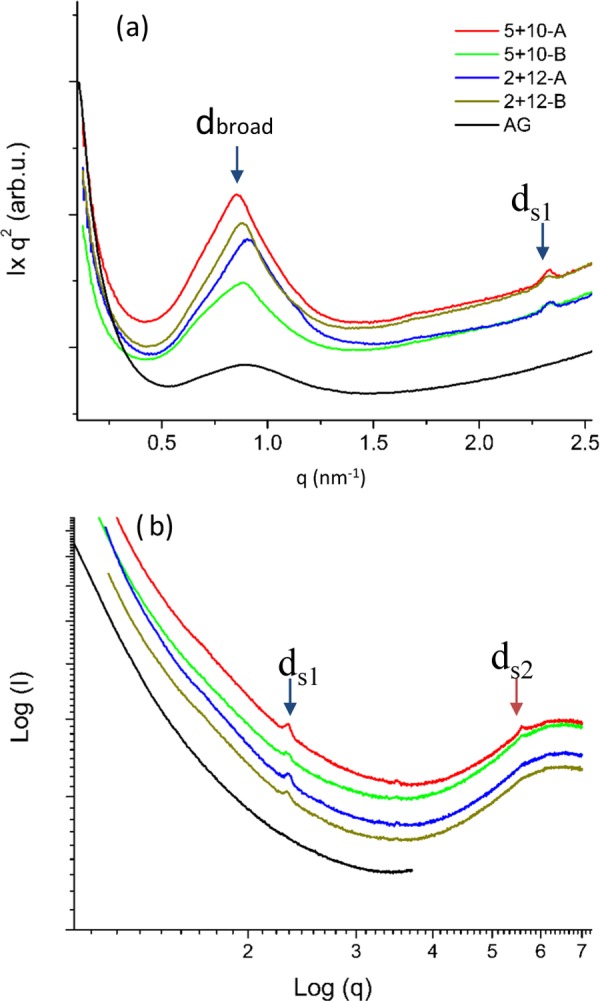
One-dimensional SAXS curves for glutenin films. (a) I × q2 vs q plots showing the dbroad and ds1 peaks (blue arrows). (b) log I vs log q plots indicating the presence of low-intensity peaks in the system.
Official websites use .gov
A
.gov website belongs to an official
government organization in the United States.
Secure .gov websites use HTTPS
A lock (
) or https:// means you've safely
connected to the .gov website. Share sensitive
information only on official, secure websites.
One-dimensional SAXS curves for glutenin films. (a) I × q2 vs q plots showing the dbroad and ds1 peaks (blue arrows). (b) log I vs log q plots indicating the presence of low-intensity peaks in the system.