
Figure 5.
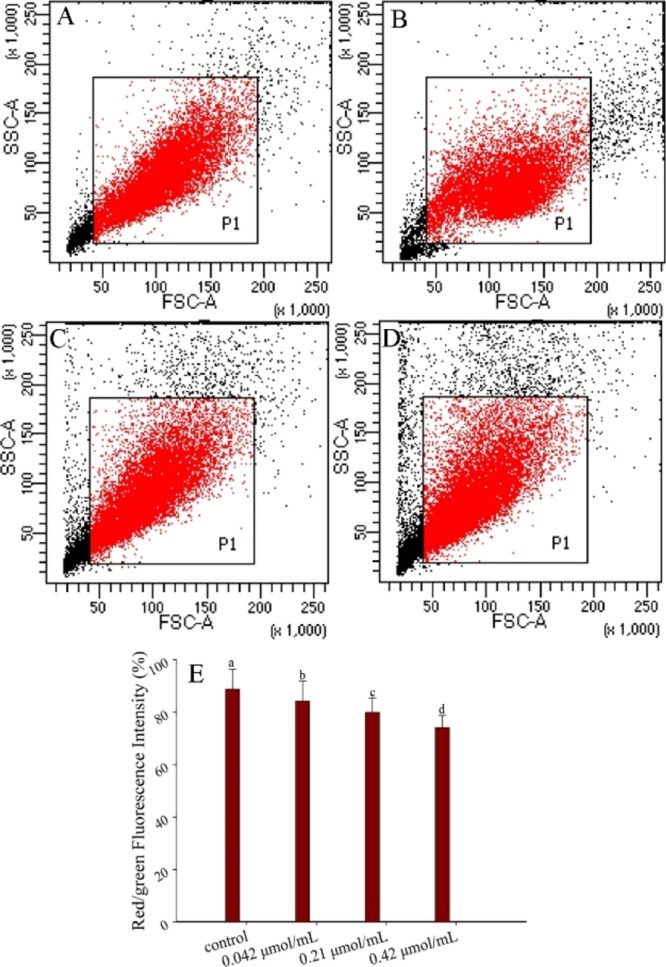
Effect of different concentrations of lucidimine B [control (A), 10 (B), 50 (C), and 100 μg/mL (D)] on MMP in MCF-7 cells, determined by flow cytometry with JC-1; P1 represents red fluorescence (aggregated by JC-1). Red/green fluorescence intensity of variation in MMP affected by lucidimine B (E) (mean ± SD, n = 3). *P < 0.05.