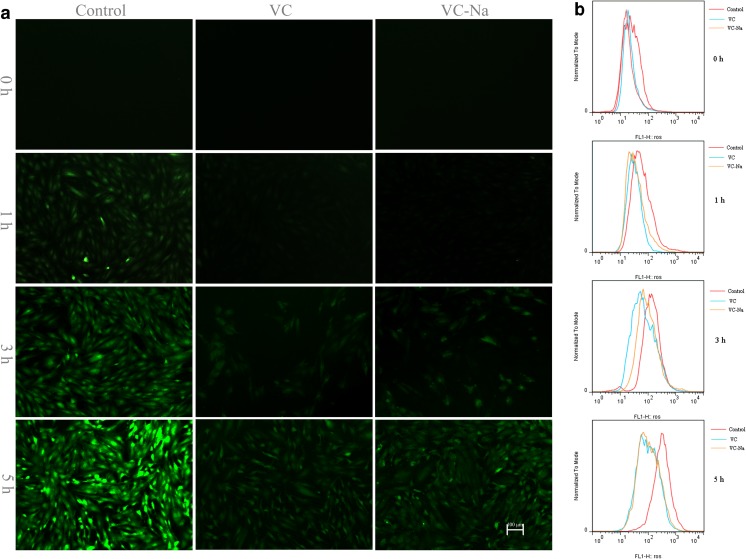
Fig. 5.
Levels of ROS in H9C2 cells following heat stress for 1, 3 and 5 h after pre-treatment with vitamin C or vitamin C-Na, or without pre-treatment (controls). a Fluorescence microscopy (bar = 100 μm) showing an enhancement in green fluorescence following continued heat stress in controls, and much weaker fluorescence in the vitamin C group and vitamin C-Na groups. b Flow cytometry showing a peak shift to the right following heat stress, and a peak shift to the left in cells supplemented with vitamin C or vitamin C-Na

