
Fig. 5.
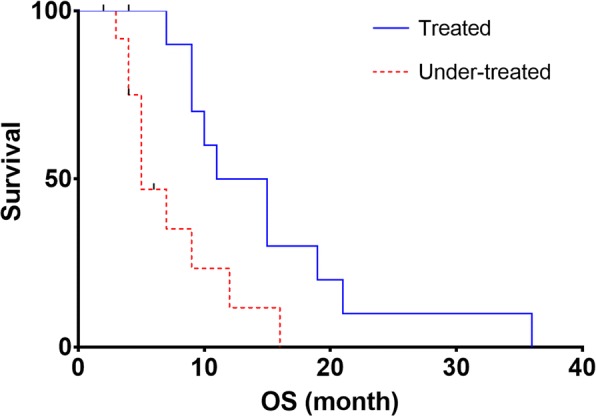
OS curves estimated by the Kaplan-Meier method according to the treated group (all the lesions received a mean absorbed dose superior to 39 Gy) versus the under-treated group (at least one lesion received a mean absorbed dose inferior to 39 Gy)