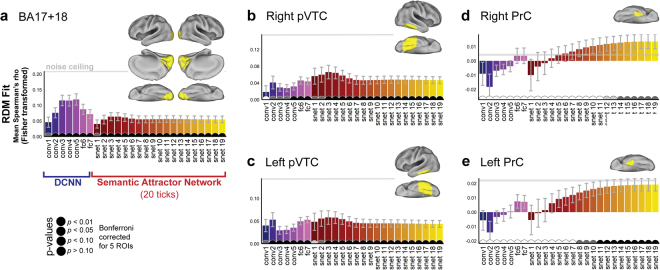
Figure 5.
Region of Interest (ROI) results comparing representations at each stage of the VS model to patterns of activation along the ventral stream. ROIs are depicted as yellow regions on the cortical surface. Error-bars are SEM across subjects. Pips on the horizontal access depict p-values for tests of whether each individual Spearman’s correlation is greater than zero (permutation test, one-sided, Bonferroni-corrected for 5 ROIs). Grey lines indicate the lower bound of the noise ceiling.

