Figure 6.
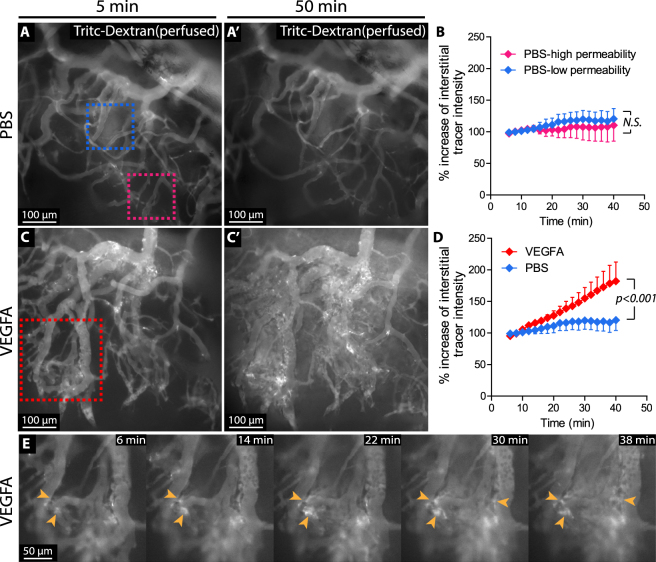
Time-lapse intravital live imaging reveals the kinetics of VEGFA-induced permeability. (A-A’) Snapshots from live-imaged, tracer-injected corneal vessel networks, 5 or 50 minutes after topical application of PBS. The blue and magenta dashed boxes in A indicate low permeability vessels (blue) and high permeability vessels (magenta), respectively. (B) Quantification of relative change in extravasated tracer intensity over time comparing low permeability vessels and high permeability vessels in the PBS treated group (N.S. calculated by Two-way ANOVA). (C-C’) Snapshots from live-imaged, tracer-injected corneal vessel networks, 5 or 50 minutes after topical application of VEGFA. (D) Quantification of the relative change in interstitial (outside of lumen) tracer intensity over time, following application of VEGFA or PBS. p < 0.001, calculated by Two-way ANOVA. (E) Time course of the area indicated in C. Arrowheads point to sites of tracer extravasation.

