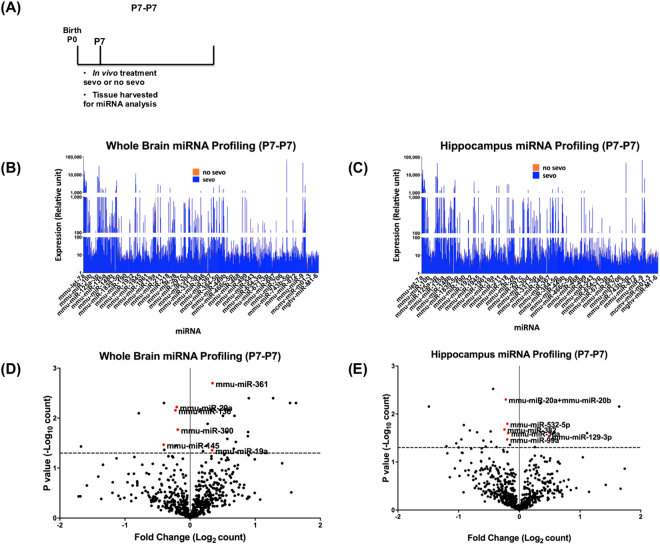
Figure 1.
Profiling of miRNA expression after neonatal sevo treatment (P7-P7). (A) The P7-P7 group represents mice that were treated at P7 followed directly by tissue collection at P7. Profiling of the 599 known mouse miRNAs from the whole brain (B) and the hippocampus (C) yielded highly heterogeneous expression patterns. Neonatal sevo did not have a global effect on miRNA expression, comparing all miRNAs in the profiling data between the no sevo vs. sevo groups (Two-way ANOVA, (I) treatment: no sevo vs. sevo, P = 0.34 for the whole brain, P = 0.23 for the hippocampus; (II) miRNAs: comparing across miRNAs, P < 0.0001 for the whole brain and the hippocampus). (D and E) Volcano plots of the profiling data show both the fold change as a result of P7 sevo treatment and miRNAs that are differentially expressed with P < 0.05 (above the dotted line). Only miRNAs (red dots) with P < 0.05 and expression over 100 (relative unit defined by the Nanostring Technology) are selected to be in Table 1 for further analysis (Multiple t-tests).

