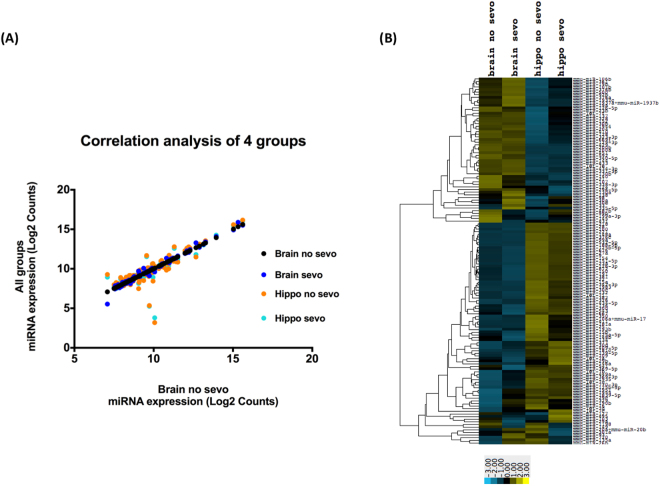
Figure 2.
Correlation analysis of miRNA profiling data (P7-P7). (A) The plot is based on whole brain no sevo’s correlation to the other 3 groups, brain sevo, hippo no sevo, hippo sevo. (B) Heatmap analysis on the 4 groups shows that the expression pattern remained similar for sevo and no sevo within the whole brain and the hippocampus. However, between regions, the color bar shifted from higher expression (yellow) in the whole brain groups to lower expression (blue) in the hippocampus groups in the top half of the heatmap. This pattern was then reversed in the lower half of the heat map, with lower expression in the whole brain groups and higher expression in the hippocampus groups.

