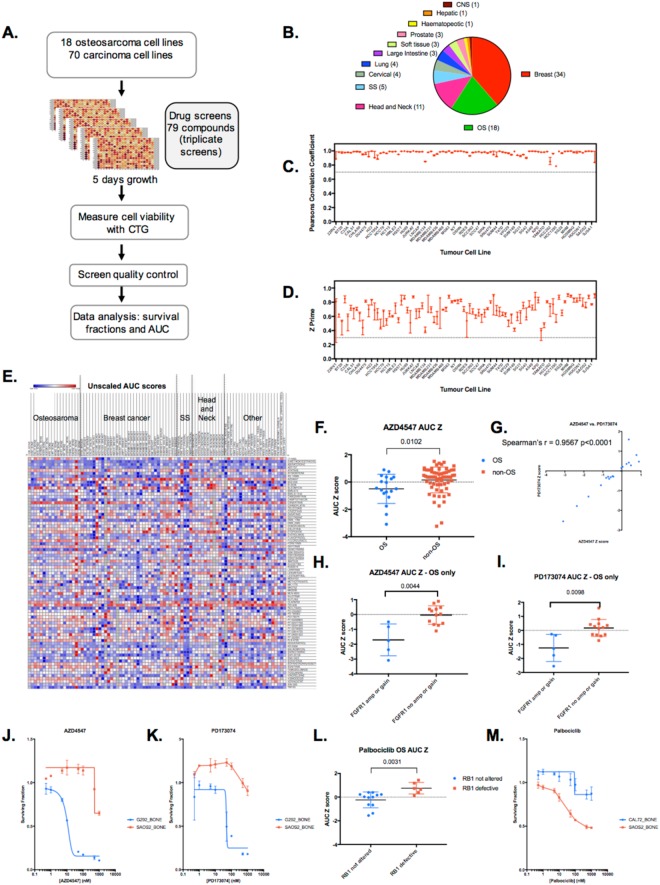
Figure 1.
Drug screening overview. (A) Schematic of high-throughput small molecule chemosensitivity screens. Tumour cell lines (TCLs) were plated in 384-well plates in log phase and exposed to small molecule inhibitors for five continuous days, at which point cell viability was estimated by use of CellTitreGlo reagent (CTG). (B) Piechart illustrating the histotypes of the 88 tumour cell lines included in the study. (C) Scatter plot of Pearson’s correlation values between triplicate screens. Only tumour cell lines that had Pearson’s correlation values between triplicate screens of >0.7 were included in the final dataset. Median and range shown. (D) Scatter plot of Z prime values for each replica of the screen. Only tumour cell lines that had median Z prime values of >0.3 were included in the final dataset. Median and range shown. (E) Heatmap illustrating Area Under the Curve (AUC) values for each drug in each tumour cell line. Heatmaps illustrating the dataset described as scaled AUC scores and unscaled AUC Z scores are show in Supplementary Figure 1. (F) Box whiskers plot of AZD4547 FGFR inhibitor AUC Z scores in 88 tumour cell lines, illustrating the relative sensitivity of OS TCLs. p value 0.0102, Mann-Whitney test. (G) Scatter plot of AZD4547 FGFR inhibitor AUC Z scores in OS TCLs, compared to AUC Z scores for the FGFR inhibitor PD173074. (H) Box whiskers plot of AZD4547 FGFR inhibitor AUC Z scores in OS tumour cell lines classified according to FGFR1 gene status. p value 0.0044, Mann-Whitney test. (I) Box whiskers plot of PD173074 FGFR inhibitor AUC Z scores in OS tumour cell lines classified according to FGFR1 gene status. p value 0.0098, Mann-Whitney test. (J,K) Example dose response survival curves derived from screen data for FGFR inhibitors in two OS TCLs, G292 (FGFR1 amplified) and SAOS2 (FGFR1 copy number neutral). (L) Box whiskers plot of Palbociclib CDK4/6 inhibitor AUC Z scores in OS tumour cell lines classified according to Rb status. p value 0.0031, Mann-Whitney test. (M) Example dose response survival curves derived from screen data for palbociclib in two OS TCLs, CAL72 (Rb defective) and SAOS2 (Rb not altered).

