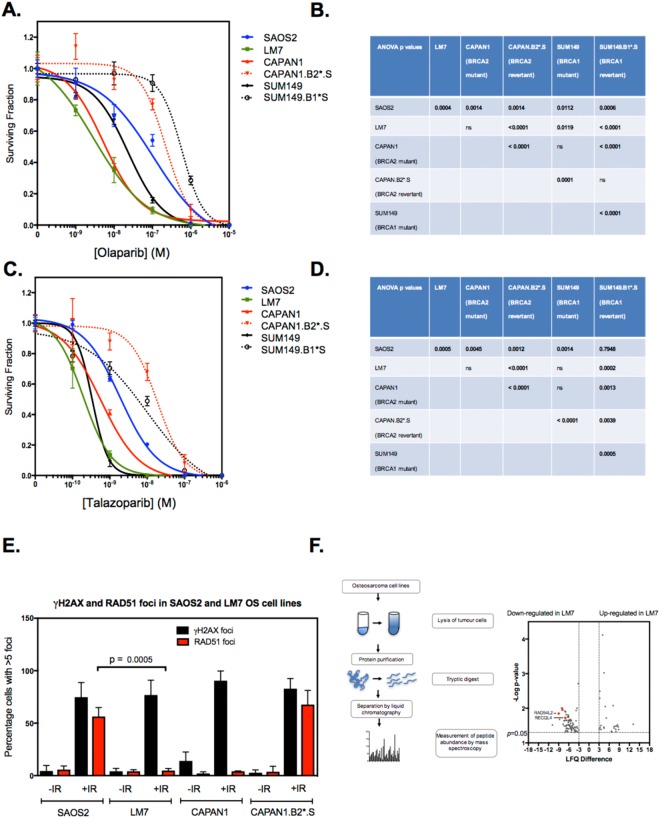
Figure 3.
PARP inhibitor sensitivity and RAD51 defects in OS tumour cell lines. (A) Olaparib dose response curves derived from clonogenic assays where TCLs were exposed to PARP inhibitor for 14 continuous days. LM7 and SAOS2 cells were compared to CAPAN1 cells (BRCA2 mutant, PARP inhibitor sensitive), CAPAN1.B2*.S (BRCA2 revertant, PARP inhibitor resistant), SUM149 (BRCA1 mutant, PARP inhibitor sensitive) and SUM149.B1*.S (BRCA1 revertant, PARP inhibitor resistant) cells. Error bars represent SEM from triplicate experiments. (B) Table illustrating ANOVA p values from olaparib sensitivity comparisons in (A). (C,D) Talazoparib dose response curves and ANOVA p values derived from clonogenic assays where TCLs were exposed to PARP inhibitor for 14 continuous days. As for (A,B) (E) Bar chart illustrating the quantitation of nuclear RAD51 foci in tumour cells after exposure to ionising radiation. Cells were plated in triplicate in 6-well plates on coverslips. After 24 hours, tumour cells were irradiated (10 Gy) and cultured for a subsequent four hours, at which point cells were fixed and immunostained. Confocal microscopy was used to visualise and score nuclear γH2AX and RAD51 foci. Cells containing more than five nuclear foci were considered positive. Mean ± SEM for three independent experiments are shown. LM7 cells exhibited significantly decreased nuclear RAD51 foci formation compared to SAOS2 (p = 0.0005). p values were calculated using Student’s t test. (F) Differential protein levels in SAOS2 and LM7 cells. Schematic of experimental procedure used to determine proteomic profiles in LM7 and parental SAOS2 cells is shown left. Following lysis, protein purification, and tryptic digest, peptides were separated by liquid chromatography and measured by mass spectrometer. Label-free proteome quantification was performed using the MaxQuant software environment to determine the quantitative abundance of 6696 peptides with a false discovery rate of less than one percent. Volcano plot of median difference in proteomic abundance between LM7 and SAOS2 shown right. RAD54L2 and RECQL4 are highlighted. Only peptides with a significant difference in abundance between LM7 and SAOS2 are shown (p < 0.05 effects (two sided heteroscedastic t-test) with an absolute difference in log2(LFQ) greater than 3).

