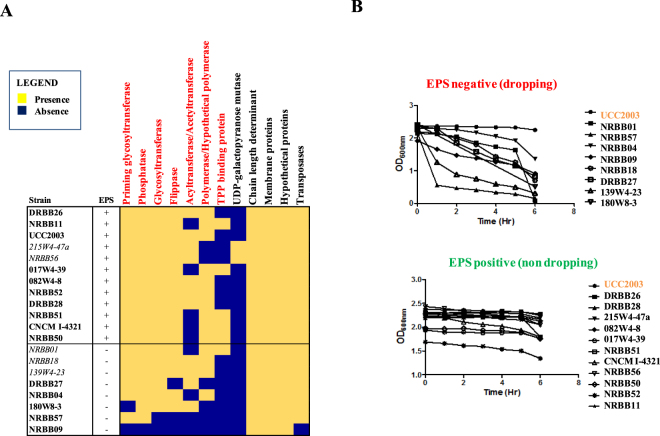
Figure 5.
GTM analysis applied to EPS production by B. breve. GTM applied to EPS production phenotype in B. breve. Panel A: Heatmap representing the EPS-associated genetic functions of which presence matched the observed EPS production phenotype (red) across the assessed B. breve strains. Five strains showing discrepant genotype/phenotype association are italicized. Panel B: EPS production phenotypic assay. Non-EPS-producers clearly show apparent reduction in OD as they ‘sediment’ to the bottom of the tube, while EPS producers do not exhibit such a sedimentation phenotype.

