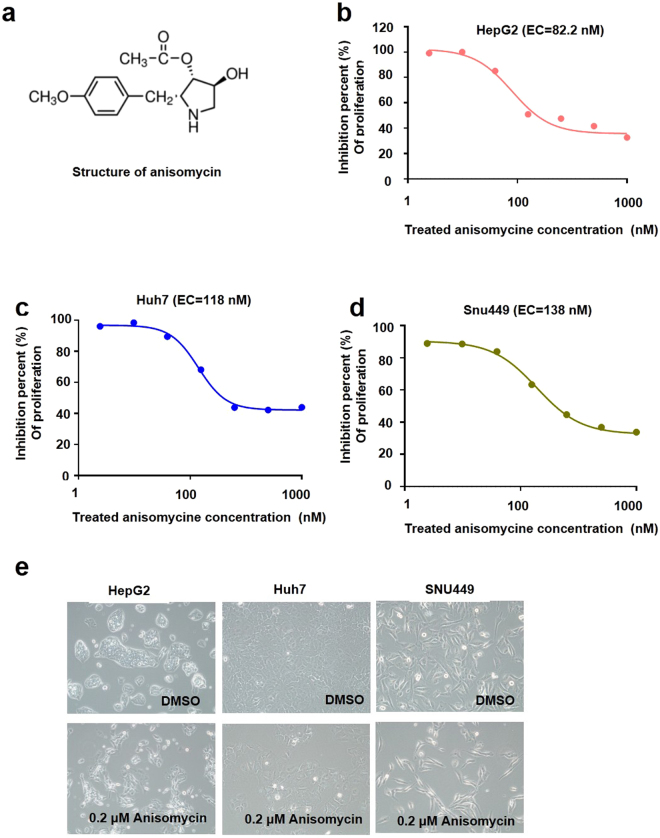
Figure 1.
Inhibitory effects of anisomycin on HCC cells. (a) Anisomycin chemical structure; percent cell proliferation inhibition caused by anisomycin treatment in (b) HepG2, (c) Huh7, and (d) SNU449 cells was determined, and data were pooled from three independent experiments. The indicated IC50 values were estimated from the concentration-response curve. (e) HepG2, Huh7, and SNU449 cells were treated with DMSO (control) or 0.2 µM anisomycin for 48 h, and photographs were taken under a light microscope. Representative images from more than three independent experiments are shown.

