Figure 2.
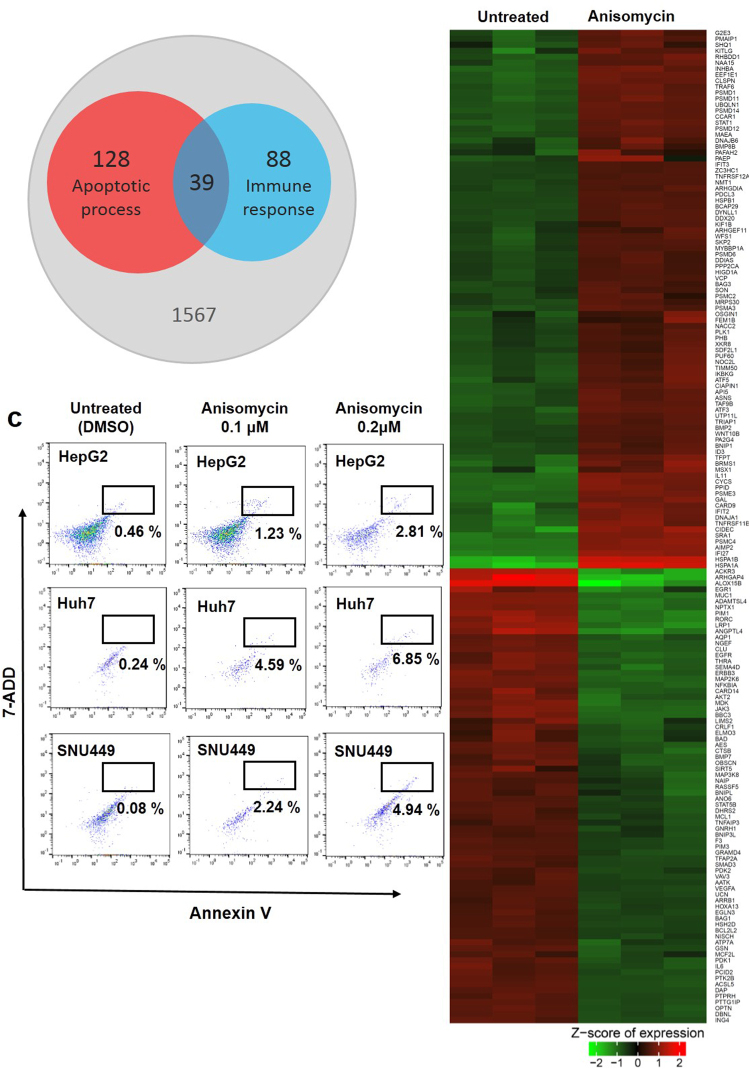
Anisomycin triggered apoptosis and regulated genes associated with apoptosis in HCC cells. (a) Venn diagrams displaying the number of differentially expressed genes associated with apoptotic process and immune response regulated in HepG2 cells after anisomycin treatment. Among 1821 genes applied for DAVID functional annotation analysis, 166 and 127 genes were identified as the associated genes for apoptotic process and immune response, respectively. And 39 genes were included in both sides. (b) Heat map representation of the expression levels of apoptosis-associated genes that were changed by more than 2-fold after anisomycin treatment of HepG2 cells in three independent experiments. The gene list for this heat map is shown in Supplementary Table 1. (c) HepG2, Huh7, and SNU449 cells were pre-treated with DMSO (control), 0.1 and 0.2 μM anisomycin for 48 h, and apoptosis was analysed by flow cytometry. Representative dot plots showing the percentage (%) of Annexin V and 7-ADD double-positive cells (apoptotic cells) from three independent experiments.

