Figure 3.
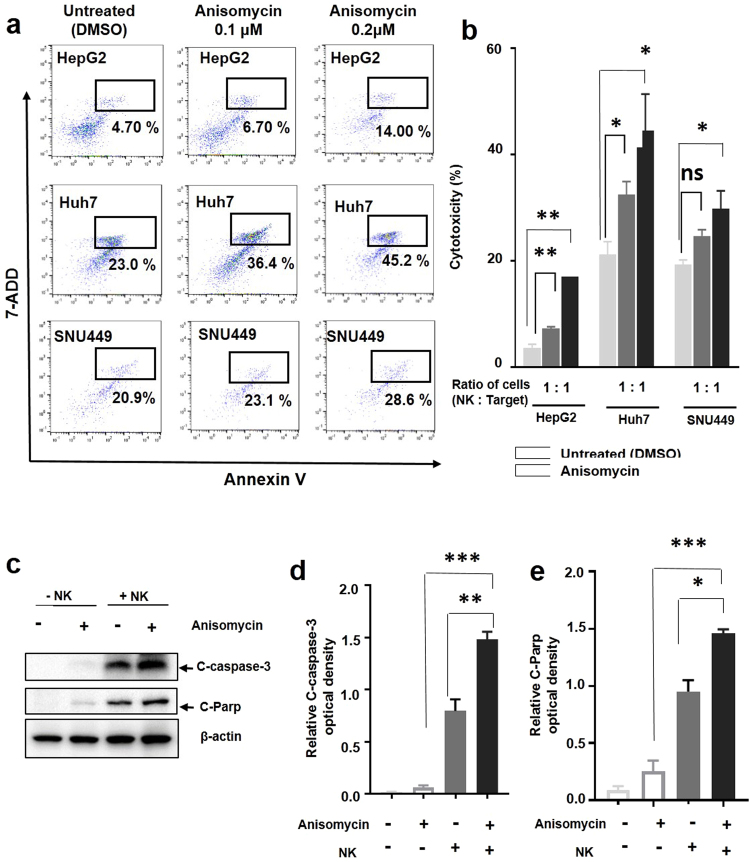
Anisomycin enhanced apoptosis-dependent NK cell cytotoxicity in HCC cells. (a) HepG2, Huh7, and SNU449 cells were pre-treated with DMSO (control), 0.1, and 0.2 μM anisomycin for 48 h and then cocultured with NK cells for 4 h. Apoptosis was analysed by flow cytometry. HepG2, Huh7, and SNU449 cells (CD56 negative) were gated with CD56 staining. Representative dot plots show the percentage (%) of Annexin V and 7ADD double-positive cells (apoptotic cells) from three independent experiments. (b) Cell cytotoxicity in cocultures of HepG2, Huh7, or SNU449 cells with NK cells. HepG2, Huh7, and SNU449 cultures were pre-treated with anisomycin or DMSO; pooled results are shown from three independent flow cytometry experiments; *,**significant differences from control (untreated) cells based on two-tailed unpaired Student’s t-tests at p < 0.05 and p < 0.01, respectively. The error bars indicate SEMs. The ratios of NK to HepG2, SNU449, and Huh7 cells are indicated. (c) HepG2 cells were pre-treated with DMSO (control) and 0.2 μM anisomycin for 48 h, cocultured with (+NK) or without NK cells (−NK) for 2 h, and then sorted into CD56-negative HepG2 cells. Protein expression in the cell lysates was analysed by immunoblotting with antibodies against cleaved caspase3 and cleaved PARP. β-Actin expression was analysed as a loading control. Full-length blots are presented in Supplementary Fig. 1. The results shown are representative of three independent experiments. (d) The densities of cleaved caspase3, and cleaved PARP were measured and normalized to β-actin levels. The relative level of cleaved caspase3 and cleaved PARP are shown. Pooled results are shown from three independent experiments; *,**,*** significant differences from the control (untreated) based on two-tailed unpaired Student’s t-tests at p < 0.05, p < 0.01, and p < 0.001, respectively. Error bars denote SEMs.

