Figure 4.
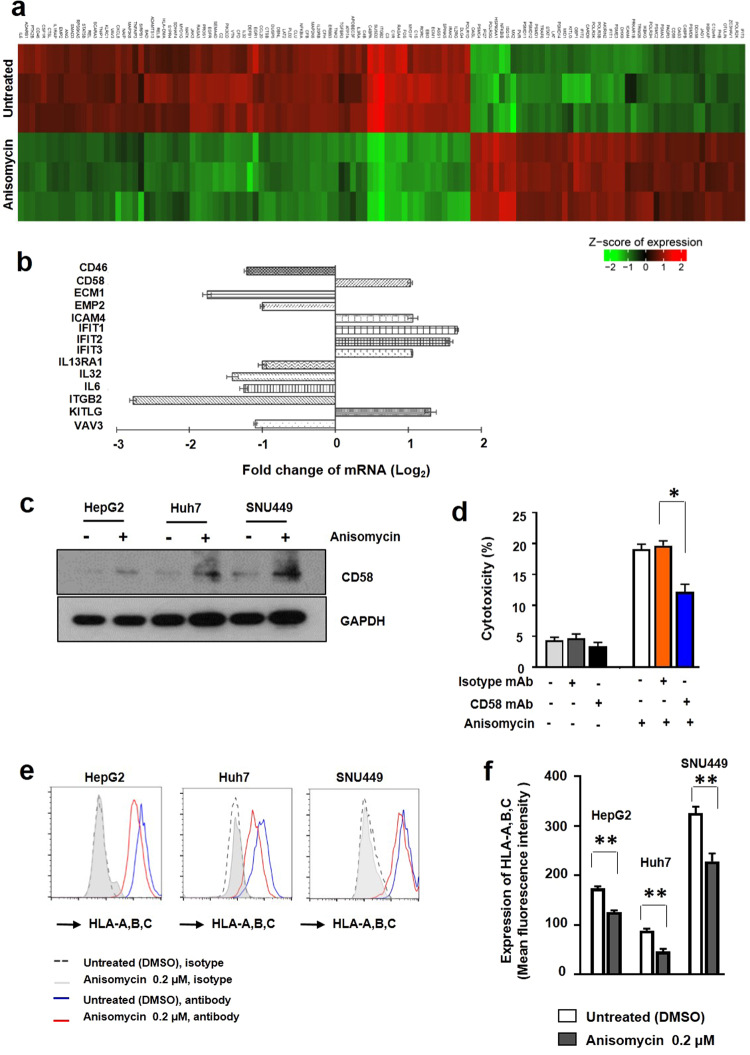
Anisomycin triggered selective regulation of genes associated with immune response-associated genes in HCC cells and the CD58 ligand-dependent effects of anisomycin on HCC cells toward NK cell cytotoxicity. (a) Heat map representation of the expression levels of immune response-associated genes that were changed by more than 2-fold after anisomycin treatment of HepG2 cells in three independent experiments. The gene list for this heat map is shown in Supplementary Table 2. (b) Selected differentially regulated genes in immune response-associated genes from microarray data. (c) HepG2, Huh7, and SNU449 cells were treated with DMSO (control) or 0.2 μM anisomycin and analysed to determine the expression levels of CD58 using western blotting. Protein expression in the cell lysates was analysed by immunoblotting with antibodies against CD58, and GAPDH expression was analysed as a loading control. Full-length blots are presented in Supplementary Fig. 2. The results shown are representative of three independent experiments. (d) HepG2 cells were pre-treated with DMSO (control) or 0.2 anisomycin for 48 h and then cocultured with NK cells for 4 h. NK cell cytotoxicity was measured using an LDH cytotoxicity assay kit with or without anti-CD58 blocking antibodies. The ratio of NK cells to HepG2 cells was 1: 1; * significant differences from the control (untreated) based on two-tailed unpaired Student’s t-tests at p < 0.05. Error bars denote SEMs. (e) HepG2, Huh7, and SNU449 cells were pre-treated with DMSO (control) or 0.2 μM anisomycin for 48 h and analysed by flow cytometry. Representative histograms are shown from three different independent experiments. (f) Pooled results are shown from three independent flow cytometry experiments; *,** significant differences from the control (untreated) by two-tailed unpaired Student’s t-tests at p < 0.05. Error bars denote SEMs.

