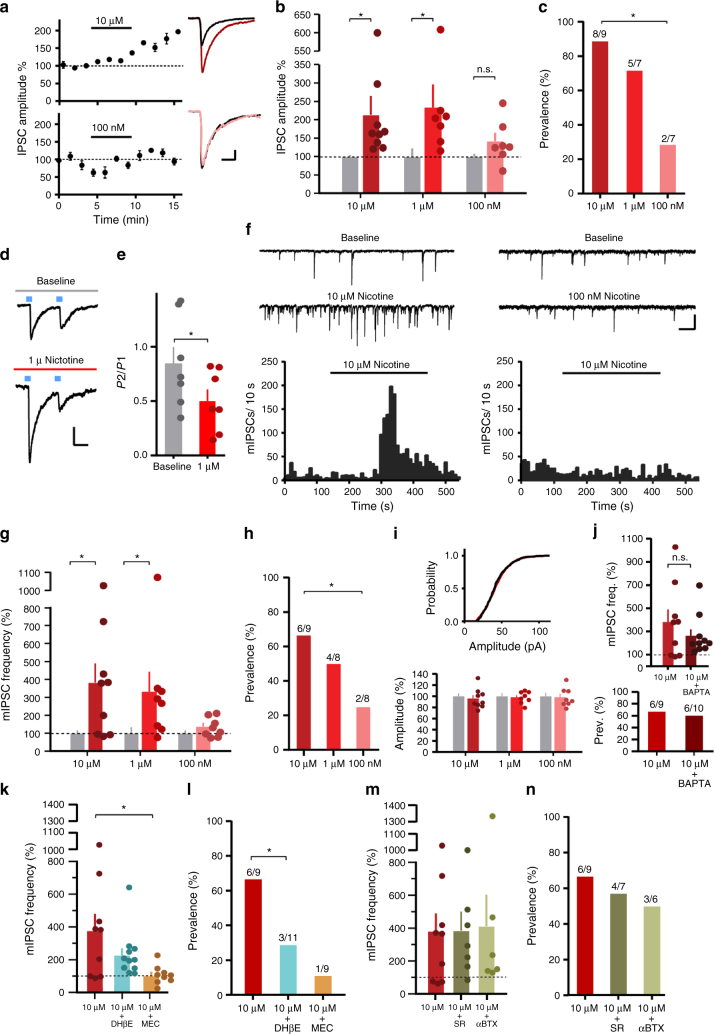
Fig. 3.
IPN inputs to LDTg are concentration-dependently modulated by nicotine via β2-containing nAChRs. a Left: example time course, normalized oIPSC amplitudes (30 ms, 50 pA scale). Right: representative traces (black: baseline, color: nicotine). b Normalized average oIPSC amplitudes, baseline (gray) vs. nicotine (colored); ratio paired t-tests (one-tailed), 10 μM: t8 = 3.492, P = 0.0041, n = 9 cells from 6 mice; 1 μM: t6 = 3.367, P = 0.0075, n = 7 cells from 3 mice; 100 nM: t6 = 1.708, P = 0.0692, n = 7 cells from 3 mice. c Prevalence of increase in oIPSC amplitudes; chi-square (two-sided), Z6.112, 1 = 2.472, P = 0.0134, n = 9, n = 7 cells. d Representative PPR traces (50 ms, 25 pA scale). e Summary PPR graph; unpaired t-test (one-sided), t12 = 1.804, P = 0.0482, n = 7 cells from 3 mice. f Upper: Representative mIPSC traces (50 ms, 50 pA scale). Lower: Representative histograms of mIPSC frequency. g Normalized average mIPSC frequencies, baseline (gray) vs. nicotine (colored); ratio paired t-tests (one-tailed), 10 μM: t8 = 3.33, P = 0.0052, n = 9 from 7 mice; 1 μM: t7 = 3.176, P = 0.0078, n = 8 cells from 3 mice; 100 nM: t7 = 1.546, P = 0.0830, n = 8 cells from 4 mice. h Prevalence of increase in mIPSC frequency; chi-square test (one-sided), Z2.951, 1 = 1.718, P = 0.0429, n = 9, n = 8 cells. i Upper: Representative cumulative amplitude histogram, baseline (black) vs. 10 μM nicotine (red). Lower: Normalized average mIPSC amplitudes, baseline (gray) vs. nicotine (colored). j Upper: 10 μM nicotine vs. 10 μM nicotine application + BAPTA in recording pipette; unpaired t-test (one-tailed), t17 = 1.012, P = 0.1629, n = 9 cells from 6 mice, n = 10 cells from 5 mice. Lower: Prevalence of mIPSC frequency increase; chi-square test (one-sided), Z0.09048, 1 = 0.3008, P = 0.3818, n = 9, n = 10 cells. k Normalized average mIPSC frequencies, 10 μM nicotine vs. 10 μM nicotine + DhβE or MEC; one-way ANOVA, y = log(y) transform, F2, 26 = 6.175, P = 0.0064 (main effect), Holm–Sidak P = 0.3830, P = 0.0048, for DhβE or MEC, respectively. l Prevalence of mIPSC frequency increase; chi-square test (one-sided), Z3.104, 1 = 1.762, P = 0.0391, n = 9 cells from 2 mice, n = 11 cells from 3 mice. m Normalized average mIPSC frequencies, 10 μM nicotine vs. 10 μM + SR or 10 μM + αBTX; n = 9, n = 7 cells from 2 mice, n = 6 cells from 2 mice. n Prevalence of mIPSC frequency increase. Data presented as mean ± SEM, * P< 0.05

