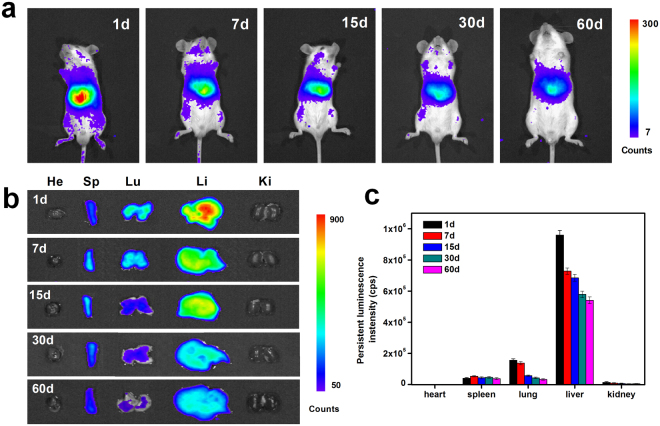
Figure 5.
In vivo and ex vivo persistent luminescence imaging. (a) In vivo persistent luminescence images of Balb/c mice with the intravenous injection of ZGO (10 mg/kg) at different time points, (b) ex vivo persistent luminescence imaging of the heart (He), liver (Li), spleen (Sp), lungs (Lu) and kidneys (Ki) collected from Balb/c mice injected with ZGO at different time points, and (c) persistent luminescence intensities of ZGO from isolated organs at different time points. The data represent the mean ± SD (n = 5)

