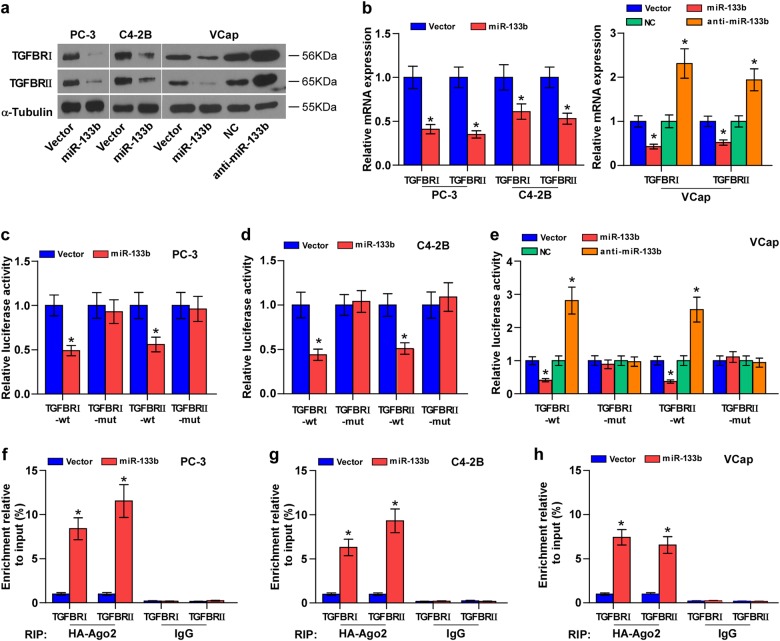
Fig. 4. miR-133b targets TGFBRI and TGFBRII.
a Western blotting of TGFBRI and TGFBRII expression in the indicated cells. α-Tubulin served as the loading control. b Real-time PCR analysis of TGFBRI and TGFBRII expression in the indicated PCa cells. Transcript levels were normalized by GAPDH expression. Error bars represent the mean ± s.d. of three independent experiments. *P < 0.05. c–e Luciferase assay of cells transfected with pmirGLO-3′-UTR reporter in the indicated PCa cells, respectively. *P < 0.05. f–h MiRNP IP assay showing the association between miR-133b and TGFBRI and TGFBRII transcripts in PCa cells. Pulldown of IgG antibody served as the negative control

