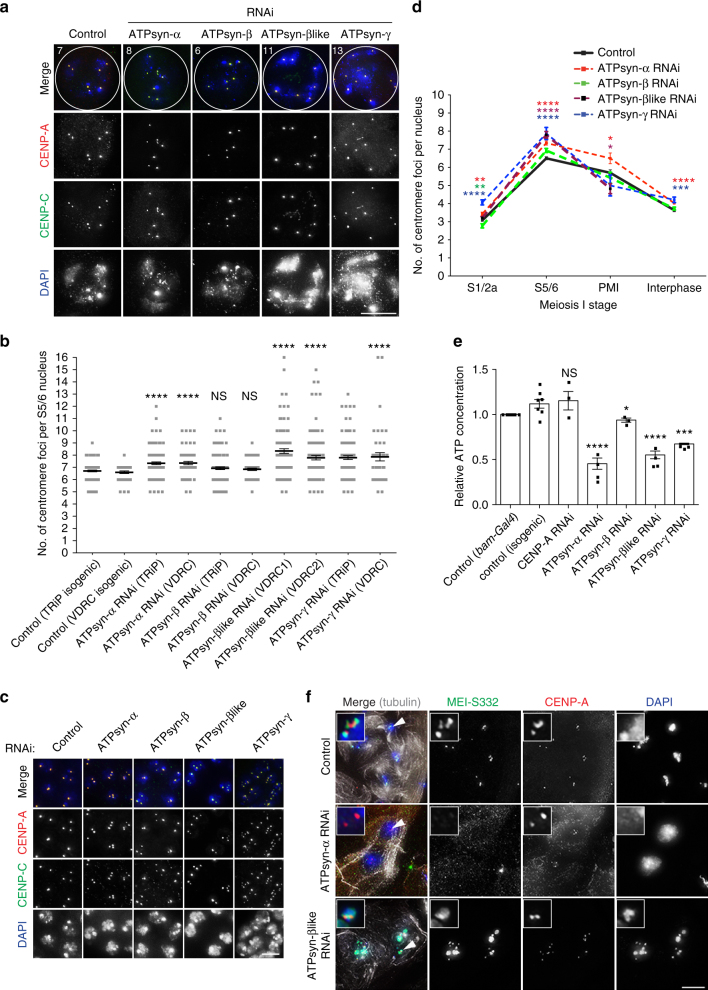
Fig. 2.
Centromere defects upon ATP synthase-α/-β/-βlike/-γ RNAi. a Immuno-fluorescent micrograph of control S5/6 nuclei or nuclei RNAi-depleted of ATPsyn-α, -β, -βlike and –γ (at 25 °C) stained with antibodies against CENP-A (red) and CENP-C (green) (n = 3). DNA is stained with DAPI (blue). Numbers indicate centromere foci per nucleus. Scale bar = 10 μm. b Quantitation of centromere foci per control S5/6 nucleus or nucleus RNAi-depleted of ATPsyn-α, -β, -βlike and –γ (at 25 °C). For each RNAi sample, p-values were calculated compared to respective TRiP or VDRC isogenic controls using an unpaired Student's t-test. The data (n = 100 nuclei) are pooled from three individual experiments. Error bars = SEM. ****p < 0.0001, NS = not significant, p > 0.05. c Immuno-fluorescent micrograph of control S1/2a nuclei or nuclei RNAi-depleted of ATPsyn-α, -β, -βlike and –γ (at 25 °C) stained with antibodies against CENP-A (red) and CENP-C (green) (n = 3). DNA is stained with DAPI (blue). Scale bar = 5 μm. d Line graph showing quantitation of the number of centromere foci per control nucleus or nucleus RNAi-depleted of ATPsyn-α, -β, -βlike and –γ at S1/2a, S5/6, prometaphase (PMI) or interphase stages of meiosis I. The data (n = 100) are pooled from three individual experiments and was analysed using an unpaired Student's t-test, ****p < 0.0001, ***p < 0.001, **p < 0.01 and *p < 0.05. Error bars = SEM. e Relative ATP concentration in control adult testes (isogenic, bam-Gal4) or testes RNAi-depleted (at 25 °C) for CENP-A, ATPsyn-α, -β, -βlike and –γ. T-test compares RNAi knockdowns to isogenic control. Experiments were carried out in triplicate and data are pooled from three independent RNAi experiments. Significance was analysed using an unpaired Student's t-test, ****p < 0.0001, *p < 0.05, NS = not significant p > 0.05. Error bars = SEM. f Immuno-fluorescent micrograph of control nuclei at prometaphase I or perturbed prometaphase I nuclei RNAi-depleted for ATPsyn-α or -βlike stained for MEI-S332 (green), CENP-A (red) and tubulin (grey) (n = 2). DNA is stained with DAPI (blue). Scale bar = 10 μm

