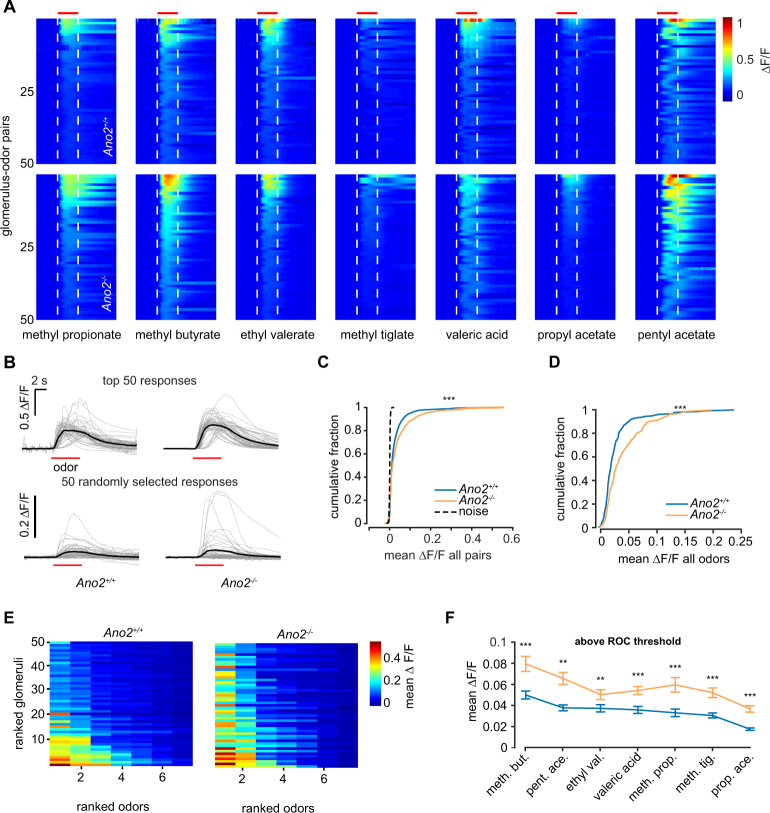
Figure 2.
Odor responses in Ano2−/− and Ano2+/+ mice. (A) The 50 largest odor-evoked Ca2+ signals across all animals for each of the seven odors in both groups. Dashed lines and red bar indicate odor delivery period. Data are sorted by the largest mean response during odor delivery. (B) Traces of the 50 largest (top) Ca2+ responses for Ano2+/+ and Ano2−/− animals across all odors and 50 randomly selected responses (bottom). (C) Cumulative distribution of the mean Ca2+ response in the odor period across all glomerulus-odor pairs (n = 2093 Ano2+/+ and 1526 Ano2−/− glomerulus-odor pairs, p < 0.001 Kolmogorov–Smirnov test). (D) Cumulative distribution of the mean Ca2+ response across all odors at each glomerulus (n = 299 Ano2+/+ glomeruli and 218 Ano2−/− glomeruli, p < 0.001, Kolmogorov–Smirnov test). (E) The top 50 glomeruli ranked by mean response across all odors and further ranked by individual odor responses for Ano2+/+ (right) and Ano2−/− (left) animals. (F) Mean response of all glomeruli responding above ROC-defined threshold (threshold = 0.005 ΔF/F, Wilcoxon rank-sum test with Bonferroni correction, *p < 0.05, **p < 0.01, ***p < 0.001).

