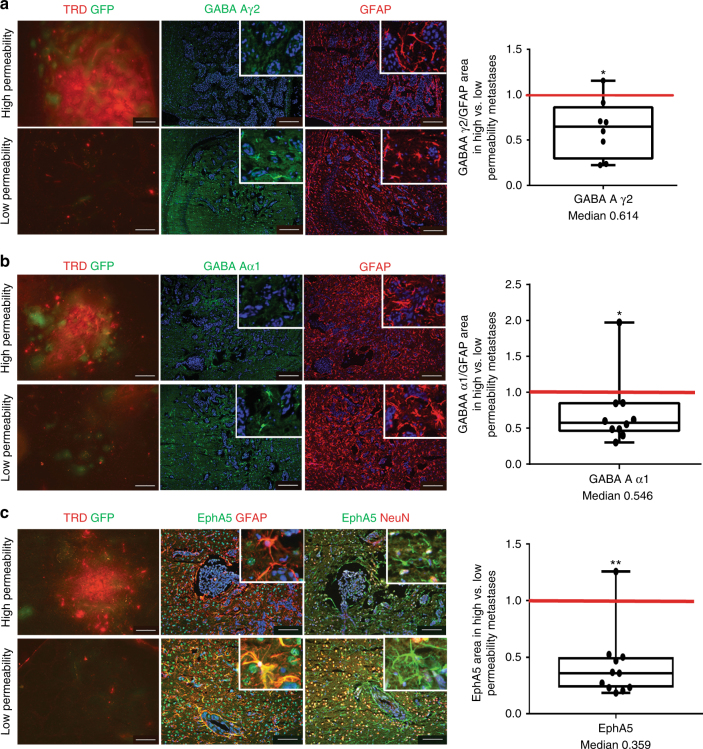
Fig. 2.
Validation of three differentially expressed microenvironmental genes at the protein level. a–c Using an independent cohort of mice harboring GFP+ 231-BR brain metastases, metastases were identified in H&E stained step sections, and those distinctly low and high in permeability to TRD identified by red fluorescence exudation. Sections in between the H&E and TRD markers were used for immunofluorescence (IF) staining. Examples of TRD exudation with IF staining in the adjacent sections for the protein of interest and the cell source are shown. For each metastasis of known permeability, the area of IF signal for a protein was normalized to the area of staining for the brain cell type(s) in which it was expressed; the ratio of staining intensity in all highly permeable/low permeable metastases in each mouse brain is shown as a single dot on the graph to the right. The red line at unity would indicate no trend in highly/poorly permeable metastases. a Representative staining for GABA Aγ2 (green), and GFAP (red) as an activated astrocytic marker for the surrounding neuroinflammatory response; DAPI stained nuclei were blue in all sections. Insets: image magnification. GABA Aγ2 staining intensity was normalized to GFAP intensity, and was compiled as a ratio of highly/poorly permeable metastases in a single mouse brain, represented on the graph as a dot. Median = 0.614 (n = 8). b A second differentially expressed GABA A receptor protein, Aα1. Median = 0.546 (n = 10). c Similar staining for Ephrin receptor EphA5, except that expression was documented in both GFAP+ astrocytes and NeuN+ neurons. EphA5 in highly/poorly permeable metastases, median = 0.359 (n = 11). From (a) to (c): graphs represent the median, the interquartile range (box) and the min/max values (error bars). Wilcoxon matched-pairs signed rank test, two-tailed, *P < 0.05, **P < 0.01 (scale bar = 100 µm)

