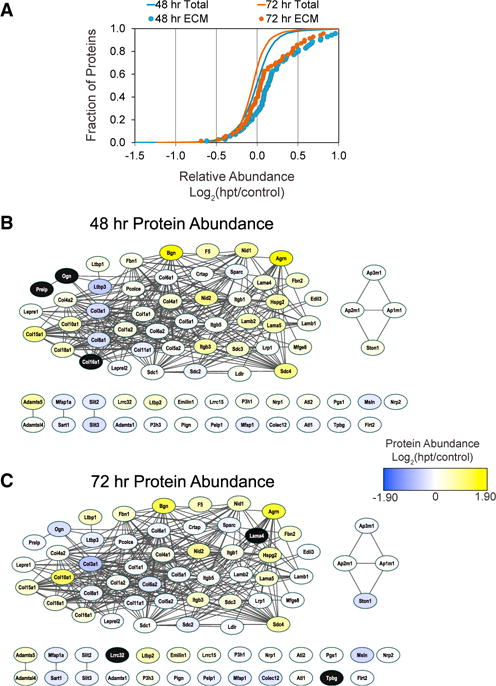
Figure 2. Extracellular Matrix Protein Networks Are Predominantly Upregulated at Both 48 and 72 hr Post-reprogramming.

(A) Gene set enrichment analysis of TMT protein ratios found that proteins annotated to the PANTHER protein class extracellular matrix protein (n = 70) were on average significantly upregulated at both 48 (blue circles, p < 8.43E-6) and 72 hr (orange circles, p < 6.3E-4) compared to the distribution of all proteins (orange and blue lines).
(B and C) The functional connectivity and relative abundance of the proteins annotated to extracellular matrix protein networks was visualized by STRING analysis. Node color indicates average relative increase (yellow) or decrease (blue) in protein abundance at 48 and 72 hr post-transduction. Black node color indicates the protein was not detected at that time point. Extracellular matrix (ECM) protein abundance was similarly increased at both time points, although on average the magnitude was greater at 48 hr.
