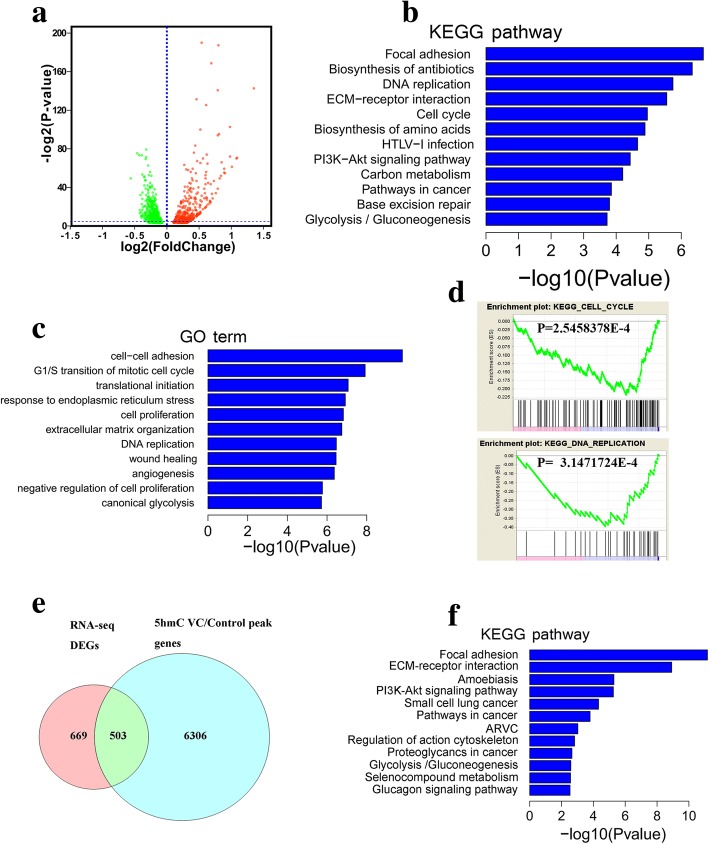
Fig. 6.
Vitamin C treatment shifted the bladder cancer cell transcriptome. a Volcano plot figure for differentially expressed genes treated with vitamin C. b, c KEGG pathway and GO term analysis results for differentially expressed genes, respectively. d Representative GSEA enrichment plots for enriched gene sets. e Venn diagrams showing the overlap between elevated 5hmC peak-associated genes and differentially expressed genes. f KEGG pathway analysis results for overlapping genes

