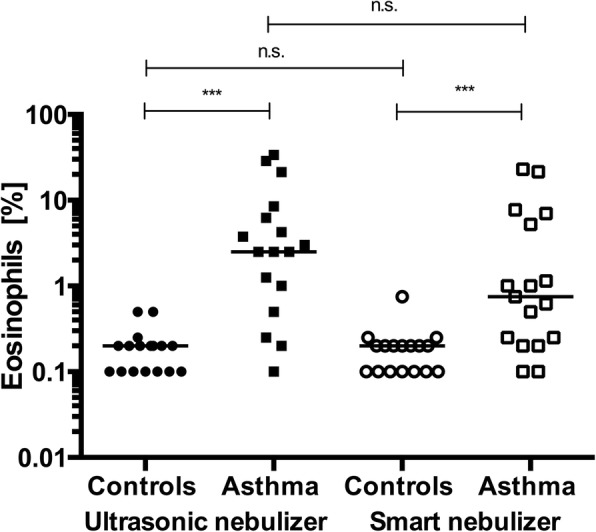
Fig. 3.

Percentage of eosinophils obtained after the use of different nebulizers. Data are presented as medians. Zero values were increased to 0, 1/0, or 2 for visualization. In the controls, p = 0.670 when comparing ultrasonic and smart nebulizers. In the patients with asthma, p = 0.816. The percentage of eosinophils was significantly elevated in patients with asthma compared to that in controls
