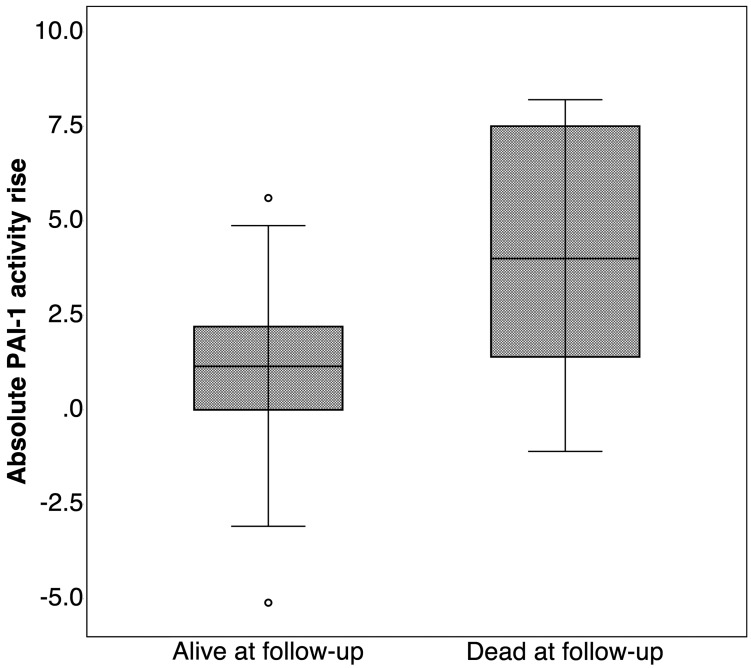
Figure 2.
Plasminogen activator inhibitor-1 (PAI-1) activity rise according to patient status on follow-up (alive or dead). Boxes represent 25th and 75th percentile ranges, horizontal line represent medians, whiskers represent 1.5 times interquartile range, and circles represent outliers (patients with values higher than 1.5 times inter-quartile range).

