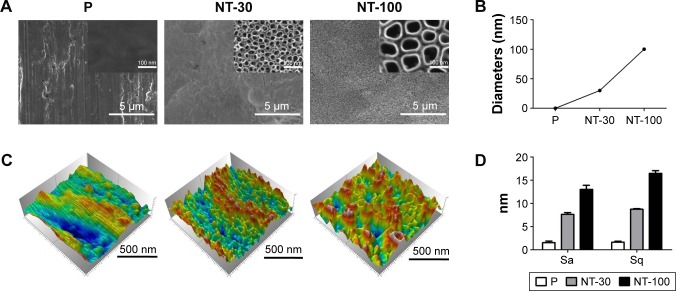
Figure 1.
The topography of Ti in different groups.
Notes: Ti implant was either P or anodized under 5 V (NT-30) and 20 V (NT-100), respectively. (A) The topography observation by FE-SEM. (B) The diameter distribution of TiO2 nanotubes (NTs). (C) The topography observation by AFM. (D) Surface roughness of Ti in different groups quantified by AFM.
Abbreviations: AFM, atomic force microscope; FE-SEM, field emission scanning electron microscope; NT, nanotube; P, polished specimen; Sa, average height; Sq, root mean square height; Ti, titanium.

