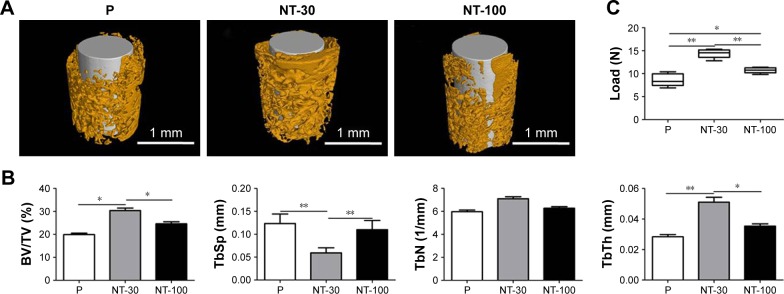
Figure 3.
The effects of Ti with different topographies on osseointegration in vivo.
Notes: The Ti implants with different nanotopographies were inserted in the femurs of normal mice and allowed to heal for 3 weeks. (A) Micro-computed tomography analysis of osseointegration around the implants with different topographies. (B) Analysis of the ratio of BV/TV, TbTh, TbN, and TbSp in the region of interest. (C) Analysis of push-in resistance in different groups. Means were compared with one-way analysis of variance combined with Bonferroni’s post-hoc test. *p<0.05; **p<0.01.
Abbreviations: BV/TV, bone volume to total volume; P, polished specimen; NT-30, titanium nanotube anodized under 5 V; NT-100, titanium nanotube anodized under 20 V; Ti, titanium; TbTh, trabecular thickness; TbN, trabecular numbers; TbSp, trabecular separation.

