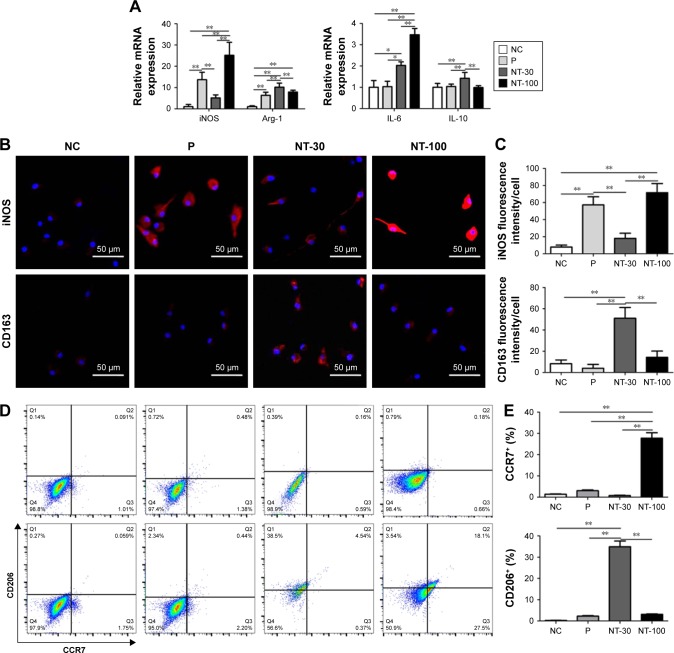
Figure 5.
The effects of different topographies on macrophage polarization in vitro.
Notes: Mice BMDMs were seeded on NC or titanium surface with different topographies for 3-day culture. (A) The mRNA expression of M1 macrophage markers (iNOS, IL-6) and M2 macrophage markers (Arg-1, IL-10) of BMDMs in different groups. (B) Confocal images of M1 and M2 macrophage markers iNOS and CD163. Magnification ×200. (C) Quantitative analysis of confocal images. (D) The scatter plot of flow cytometry detection of M1 and M2 macrophage surface markers CCR7 and CD206. (E) The percentage of CCR7+ BMDMs (M1) and CD206+ BMDMs (M2) determined by flow cytometry. Means were compared with one-way analysis of variance combined with Bonferroni’s post-hoc test. *p<0.05; **p<0.01.
Abbreviations: BMDMs, bone marrow-derived macrophages; iNOS, inducible nitric oxide synthase; Arg-1, arginase-1; IL, interleukin; P, polished specimen; NC, negative control; NT-30, titanium nanotube anodized under 5 V; NT-100, titanium nanotube anodized under 20 V.

