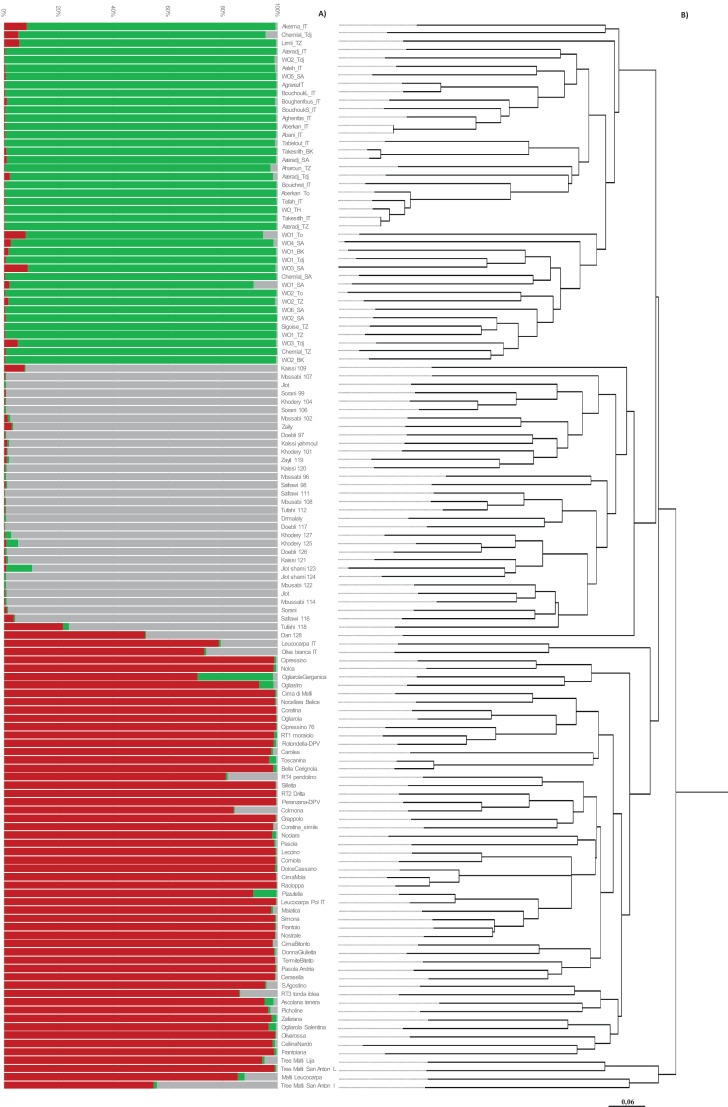
Figure 2. Genetic structure and phylogenetic tree of Mediterranean olive genotypes.
(A) Bar plot showing clusters inferred by STRUCTURE. Each vertical line stands for a single accession and it is divided into K colored segments that represent the estimated membership coefficient (q). Maltese accessions are grouped with Italian genotypes. (B) Neighbor-Joining dendrogram obtained with DARWIN v 6.0.010.

