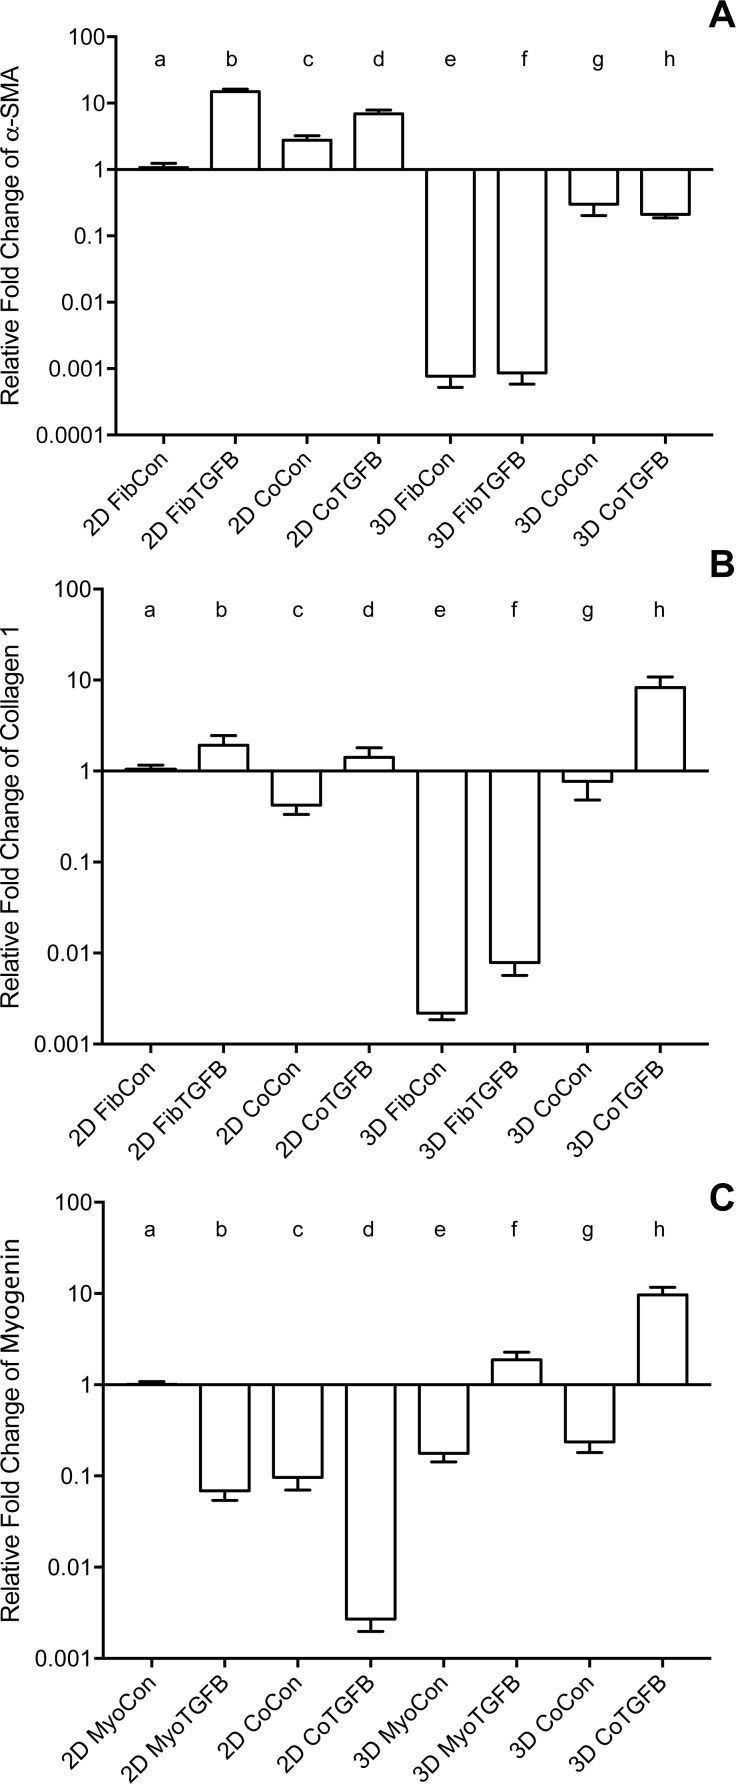
Figure 3. Gene expression of fibroblast collagen 1 and α-SMA and myoblast myogenin in 2D cell cultures and 3D self-assembled tissue conditions.
Species-specific gene expression for all groups is normalized to gene expression for group (a), 2D FibCon or MyoCon samples. Average fold change values are reported with standard error bars. Significance values were defined at p < 0.01. (A) α-SMA: (a) is significantly different from (b), (d), (e), (f), (g), and (h); (b) is significantly different from (c), (e), (f), (g), and (h); (c) is significantly different from (e), (f), (g), and (h); (d) is significantly different from (e), (f), (g), and (h); (e) is significantly different from (g) and (h); and (f) is significantly different from (g) and (h). (B) COL1: (a) is significantly different from (e), (f), and (h); (b) is significantly different from (c), (e), (f), and (h); (c) is significantly different from (e), (f), and (h); (d) is significantly different from (e), (f), and (h); (e) is significantly different from (g) and (h); (f) is significantly different from (g) and (h); and (g) is significantly different from (h). (C) MYOG: (a) is significantly different from (b), (c), (d), (e), (g), and (h); (b) is significantly different from (d), (f), (g), and (h); (c) is significantly different from (d), (f), and (h); (d) is significantly different from (e), (f), (g), and (h); (e) is significantly different from (f) and (h); (f) is significantly different from (g) and (h); and (g) is significantly different from (h).

