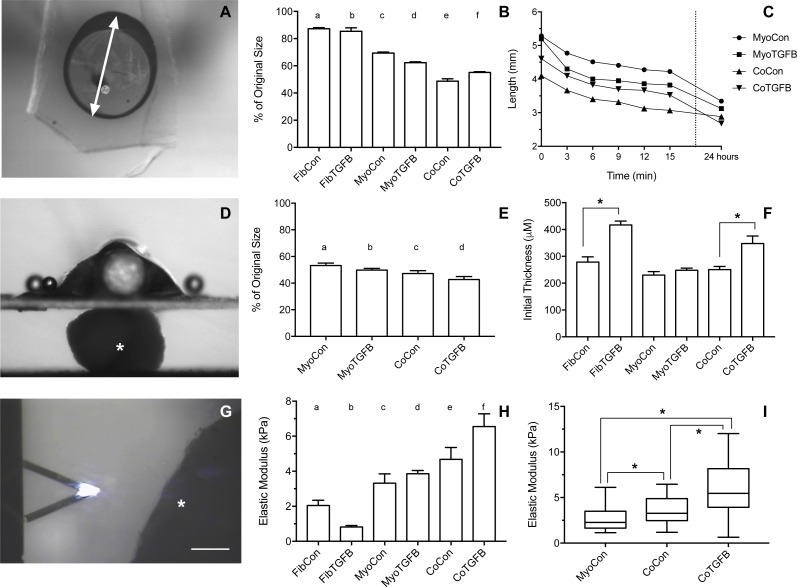
Figure 5. Biomechanical and elastic properties of 3D tissue constructs.
(A) An agarose gel mold with central post and tissue of tissue skewered onto a microbeam from the Microsquisher system. The white arrow denotes the longest axis of the tissue constructs used to track slacking from initial length in the whole tissue slack test, scale bar = 1,000 μm. (B) Percent (%) of initial length of the longest axis of tissue samples in the whole tissue slack test 27 min after their removal from agarose gels. All groups shortened from their original size significantly (p < 0.001), with significant differences between each group (p < 0.05), except for (a) and (b). (C) The shortening length of tissue samples over 3 min intervals in the cleaved tissue slack test. Note the final data point is at 24 hours, and the Y-axis origin is 2 mm. (D) Image of the Microsquisher system used to obtain elastic’s modulus of tissue sections (white asterisk); scale bar = 300 μm. (E) Percent (%) of initial length of tissue samples in the cleaved tissue slack test after 24 h. All groups shortened from their original size significantly (p < 0.001), with significant differences between each group (p < 0.05), except for (b) and (c). (F) Initial thickness of tissue samples, asterisks indicate p < 0.001. (G) Screenshot of AFM cantilever and sample (white asterisk), scale bar = 100 μm. (H) Young’s modulus of tissues generated from Microsquisher force-displacement data. (a) is significantly softer than (e) and (f); (b) is significantly softer than (c), (d), (e), and (f); and (c) and (d) are significantly softer than (f), with p < 0.001. (I) Young’s modulus of MyoCon, CoCon, and CoTGFβ tissues calculated by AFM, asterisks indicate p < 0.01. Graphs display group averages with standard error bars.

