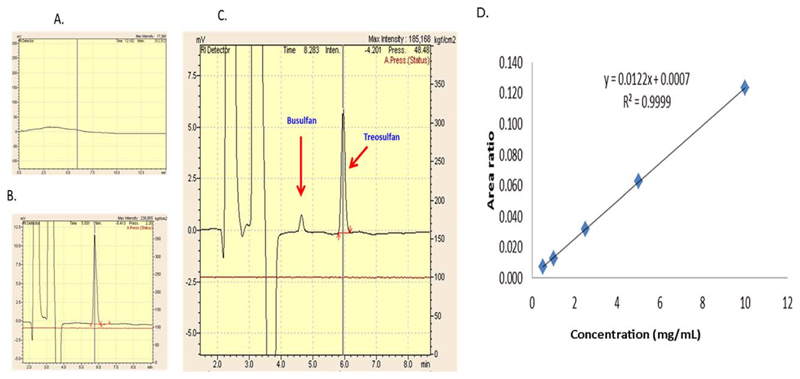
Figure 1. Treo assay in HPLC-coupled with RI detector.
(a) The blank plasma with no matrix effect and (b) the plasma spiked with standard Treo. (c) A patient’s sample showing Treo at 5.8 min and internal standard busulfan at 4.7 min. (d) The linearity and range from 0.5 to 10 mg/mL of Treo in human plasma and is depicted by the concentration vs. area ratio curve.

