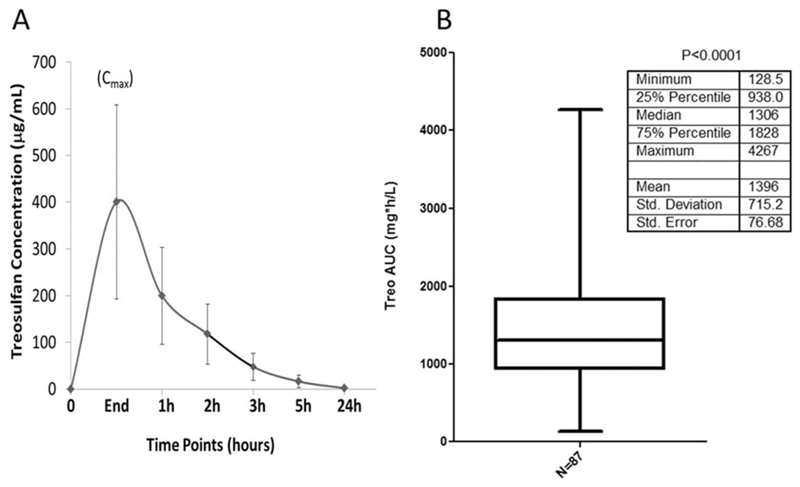
Figure 2. Interindividual variation of Treo exposure in TM patients.
(a) The concentrations of all the patients at each timepoint represented as mean ± SD. (b) The distribution of AUC of all the patients. There was a significant interindividual variation (P < 0.0001) as analyzed by one-sample t-test.

