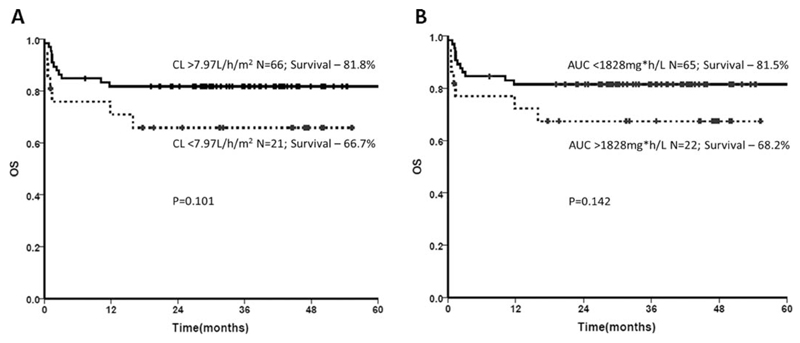
Figure 3. Influence of Treo CL and AUC on OS.
(a) Cox-regression analysis on the Treo CL quartiles indicates patients with high clearance >7.97 L/h/m2 (75th percentile) tended to have a better OS (P = 0.101) as shown by the Kaplan–Meier curve. (b) Cox-regression analysis on the Treo AUC quartiles shows that patients with low AUC <1,828 mg*h/L (25th percentile) tended to have a better OS (P = 0.142).

