Figure 4.
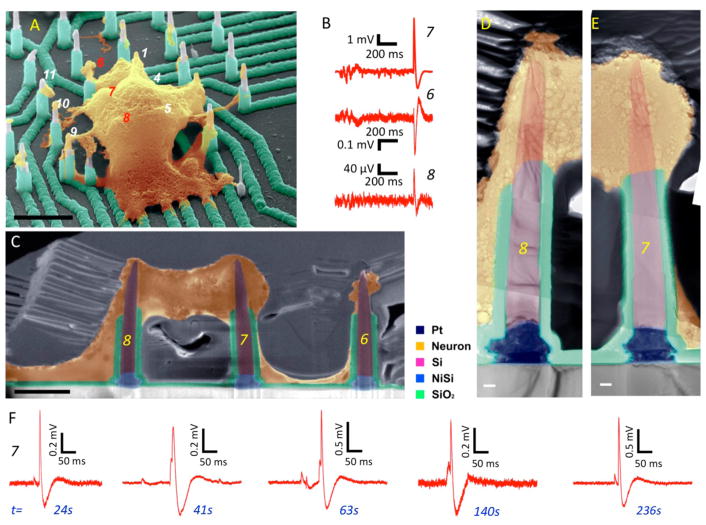
Recording from hiPSC-derived cortical neurons. (A) Colorized angle-view SEM image showing cell morphology and neurite outgrowth to nearby nanowires. Scale bar is 4 μm. (B) Measured potentials on channels 6–8 showing positive potentials for wires 7 and 8 inside the cell and negative potential for wire 6 outside the cell. (C) Colorized SEM image of the Pt coated and FIB thinned cross-section of the cell in panel B. The image shows the cell (yellow colored) engulfing the tops of nanowires 7 and 8, and portions of cell membrane around nanowire 6. Scale bar is 2 μm. Electrophysiology was performed 6 weeks post in vitro culture. (D, E) Higher magnification colorized TEM images collected and stacked to provide a higher resolution close-up to the nanowire-cell interface. The slight bending of the nanowires is likely to have happened during neuron dehydration in preparation for SEM imaging (section 5 of Supporting Information). Scale bars are 200 nm. (F) Recordings on nanowire number 7 illustrating consistent oscillations prior to action potential firing at different recording times.

