
Figure 1.
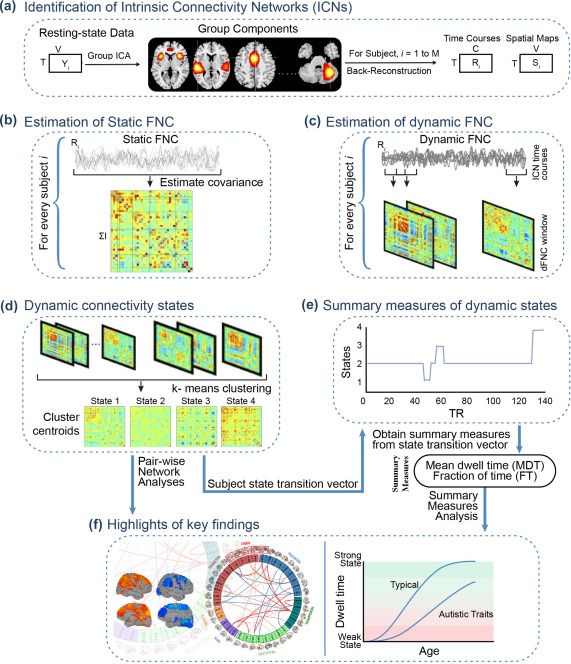
Graphical depiction of the analysis method and key findings. (a) The static and dynamic functional network connectivity (FNC) approach begins with group‐independent component analysis (ICA) to decompose resting‐state fMRI data into intrinsic connectivity networks (ICNs). The group ICA approach provides a measure of the component time courses and spatial maps for each subject using the back‐reconstruction technique. (b) Static FNC between components is estimated as the covariance of the time courses. (c) Dynamic FNC is estimated as the covariance from windowed portions of the time courses. (d) K‐means clustering is used to identify discrete dynamic connectivity states. (e) Results obtained from k‐means clustering are used to determine which state a given subject is occupying at a given time, and summary measures of dynamic states, such as, mean dwell time (MDT) and fraction of time (FT) spent in each state over the duration of the measurement period are computed. (f) Highlights of the key findings for pairwise network analyses and summary measures analyses in association with age, sex, and autistic traits [Color figure can be viewed at http://wileyonlinelibrary.com]