
Figure 5.
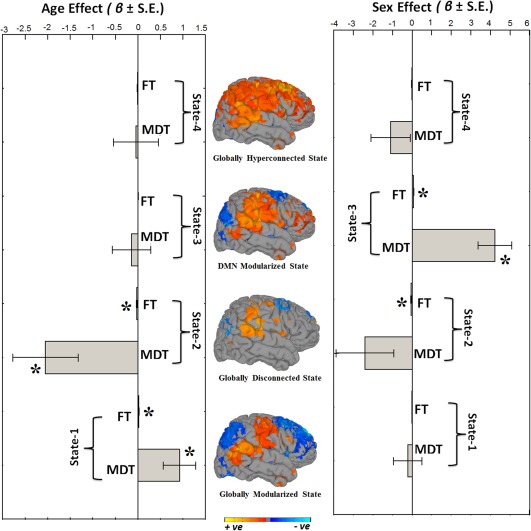
Summary metrics and age‐ and sex‐ effects. Summary metrics from the four dynamic connectivity states in relation to age and sex. Mean dwell time (MDT) represents how long an individual spends in a given state on average, and fraction of time (FT) is the summed total time spent in a given state over the course of the measurement period. For age associations, positive beta coefficient (β) indicates older children spend more time in that particular state whereas negative beta coefficient (β) indicates younger children spend more time in a particular state. For sex analyses, positive beta coefficient (β) indicates girls spend more time in the state relative to boys and negative beta coefficient (β) indicates that boys spend more time in the state relative to girls. Bar graphs indicate the unstandardized beta coefficients (β) with standard error (S.E.) from regression models, and asterisks (*) indicate the results survived the false discovery rate (FDR) multiple comparison correction threshold of p FDR = .05. The rendering brain maps are showing modularized positive (red) and negative (blue) connectivity for the corresponding dynamic states [Color figure can be viewed at http://wileyonlinelibrary.com]