Figure 6.

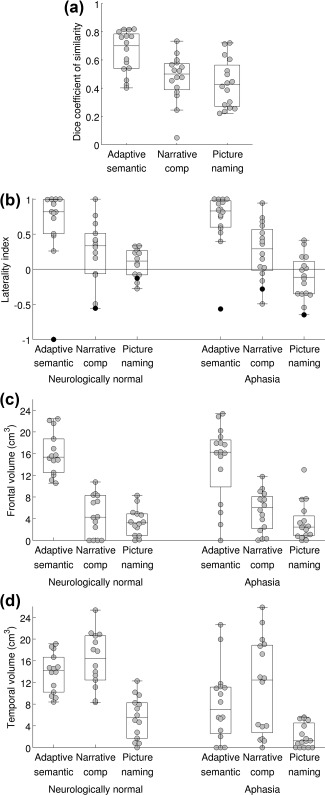
Psychometric assessment of the three paradigms. (a) Test–retest reproducibility of the three paradigms in individuals with aphasia. The distribution of the Dice coefficient is plotted (relative voxelwise threshold = 5%; minimum cluster volume = 2 cm3; ROI = Lang+, that is language regions and plausible candidates for reorganization). (b) Lateralization of language maps. The distribution of the lateralization index is plotted for neurologically normal individuals, and for individuals with aphasia, for each of the three paradigms. Individuals with apparent right hemisphere language dominance are indicated with black dots (NN14 and A12). (c) Sensitivity for detection of dominant hemisphere frontal language area. The distribution of the activation volume in the dominant inferior frontal gyrus is plotted for neurologically normal individuals, and for individuals with aphasia, for each of the three paradigms. (d) Sensitivity for detection of dominant hemisphere temporal language area. The distribution of the activation volume in the temporal ROI is plotted for neurologically normal individuals, and for individuals with aphasia, for each of the three paradigms
