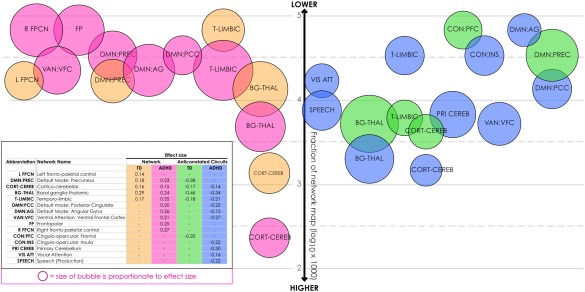
Figure 3.

Maturational effect size and proportion of intrinsic networks and their anticorrelated circuits implicated in maturational effects. The relative size of maturation effects found in individual intrinsic networks and their anticorrelated circuits is displayed, calculated by averaging the beta over clustered voxels with significant effects in each network. The position of each effect relative to the vertical axis represents the fraction of voxels in the entire network displaying significant maturational effects. This proportion is shown in a log scale, where 2 = larger fraction and 5 = smaller fraction [Color figure can be viewed at http://wileyonlinelibrary.com]
