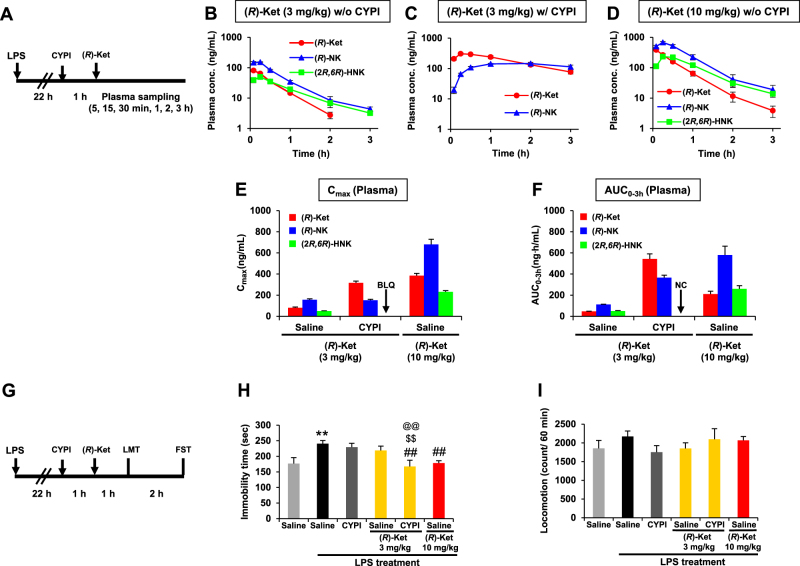
Fig. 2.
Effects of cytochrome P450 inhibitors (CYPI) on the antidepressant effects and pharmacokinetic profiles of (R)-ketamine ((R)-Ket) in the lipopolysaccharide (LPS)-induced inflammation model. a Experimental schedules for the pharmacokinetic studies following the intraperitoneal administration of (R)-Ket. b–d Plasma concentration–time profiles of (R)-Ket, (R)-norketamine ((R)-NK), and (2 R,6 R)-hydroxynorketamine ((2 R,6 R)-HNK) after the administration of (R)-Ket (3 mg/kg) without (b) and with (c) CYPI pretreatment, and (R)-Ket (10 mg/kg) without CYPI pretreatment (d). Following the administration of (R)-Ket, blood was collected sequentially at 5, 15, and 30 min and at 1, 2, and 3 h from the tail vein of each individual mouse. e, f Effect of CYPI pretreatment on the plasma maximum concentration (Cmax; e) and the area under the concentration–time curve from time 0 to 3 h (AUC0-3h; F) of (R)-Ket, (R)-NK, and (2 R,6 R)-HNK. Pretreatment with CYPI completely blocked (2 R,6 R)-HNK formation to below the lower limit of quantification (BLQ; < 3 ng/mL); therefore, the AUC0–3h was not calculable (NC) because of the BLQ of the analyte. b–f Data are represented as the mean ± SEM (n = 3/group). g Experimental schedules for the evaluation of the pharmacological effects of (R)-Ket. h Effects of (R)-Ket on the LPS-increased immobility in the forced swimming test (FST) in the presence or absence of CYPI (one-way analysis of variance, F5,42 = 4.707, P = 0.002). i Effects of (R)-Ket on the locomotion test in the presence or absence of CYPI (LMT; F5,42 = 0.804, P = 0.553). h, i Data are represented as the mean ± SEM (n = 8/group). **P < 0.01 compared with saline, ##P < 0.01 compared with saline–LPS treatment, @@P < 0.01 compared with CYPI/(R)-ketamine (3 mg/kg)-LPS treatment, $$P < 0.01 compared with saline/(R)-ketamine (3 mg/kg)-LPS treatment

