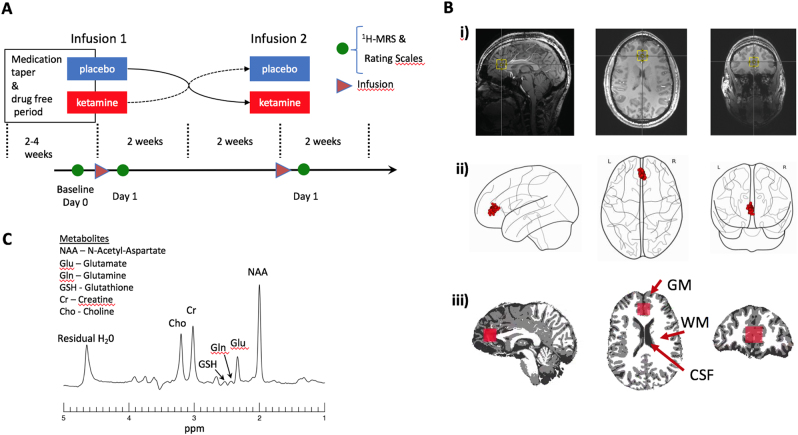
Fig. 1.
a Schematic of the double-blind, placebo-controlled, crossover study illustrating the timing of the medication taper, ketamine and placebo infusions (triangle), and magnetic resonance spectroscopy (MRS) imaging (circle). b (i) Example voxel location (yellow box) shown overlaid on an anatomical image slice in the saggital (left), axial (middle), and coronal directions. (ii) Centroid locations of all MRS voxels overlaid on a glass brain. (iii) Example segmentation into gray matter (GM), white matter (WM), and cerebrospinal fluid (CSF) with overlaid voxel location in red. (c) Example voxel spectrum labeled with modeled metabolites

