Fig. 1.
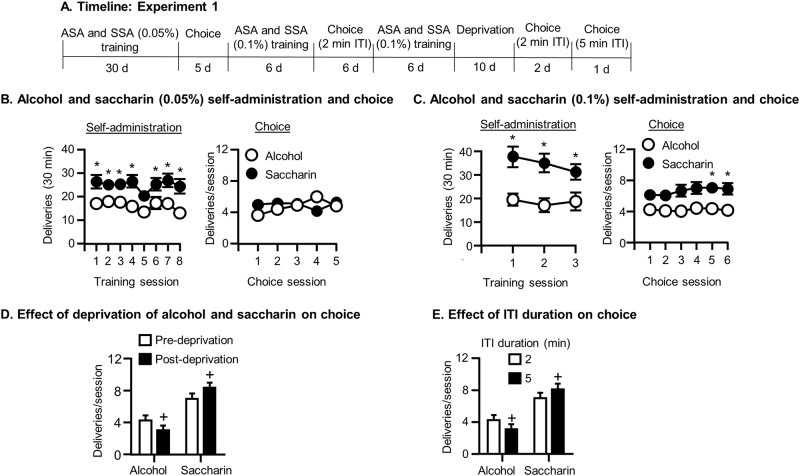
Alcohol and saccharin choice (Exp. 1). a Timeline of the experiment. b Self-administration and choice of alcohol and saccharin (0.05%): Mean ± SEM number of alcohol and saccharin (0.05%) deliveries during the last 8 days of self-administration (left) and the 5 daily choice tests (right). c Self-administration and choice of alcohol and saccharin (0.1%): Mean ± SEM number of alcohol and saccharin (0.1%) deliveries during self-administration (left) and subsequent choice tests (right). d Effect of deprivation of alcohol and saccharin on choice between alcohol and saccharin: Mean ± SEM number of alcohol and saccharin deliveries during choice tests before and after 10 days of alcohol and saccharin deprivation. e Effect of ITI duration on choice between alcohol and saccharin: Mean ± SEM number of alcohol and saccharin deliveries during choice tests with 2 and 5 min ITIs. *Different from alcohol, +different from pre-deprivation baseline (d) or from 2 min ITI (e) (ps < 0.05). N = 31. ASA alcohol self-administration, SSA saccharin self-administration, ITI intertrial interval

