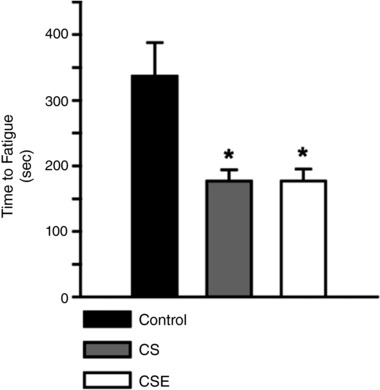
Figure 3. In situ fatigue resistance in response to both cigarette smoke exposures.

The time to reach 50% of initial force (fatigue) was measured in the gastrocnemius–plantaris–soleus (GPS) complex electrically stimulated to repeatedly contract. The average fatigue time is presented ± SEM for control (n = 10), CS (n = 6) and CSE (n = 6) mice. * indicates a difference from the control time, P < 0.05.
