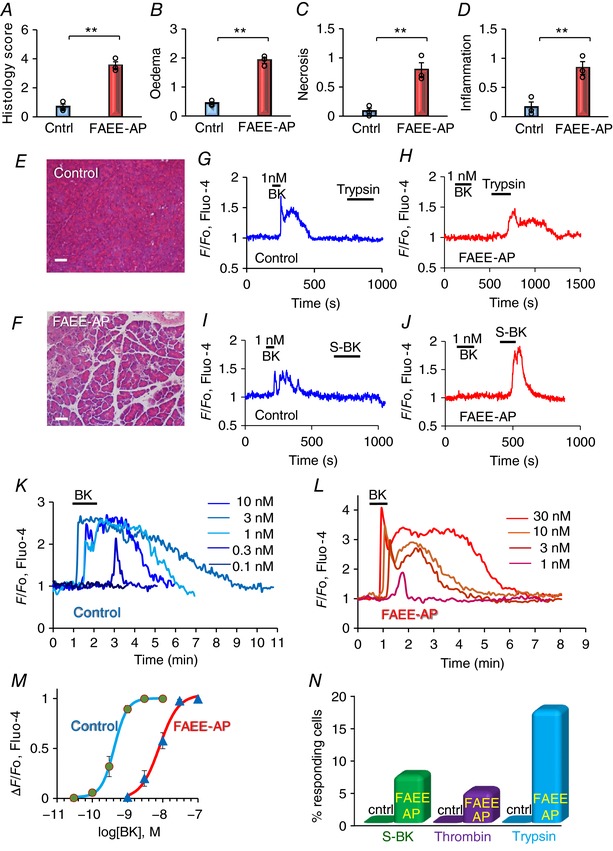
Figure 7. Functional changes in PSCs due to alcohol‐induced AP (POA/ethanol in vivo mouse model – FAEE‐AP).

A–F, the successful induction of AP was investigated by histological assessments of fixed pancreatic slices. Comparisons were made between pancreatic slices from control mice and FAAE‐AP mice. Overall histology score (A), degree of oedema (B), extent of necrosis (C) and degree of inflammation (D) were recorded (** P < 0.01). Representative images of pancreatic histology sections from control (E) and FAEE‐AP (F) mice are also shown (bars: 50 μm). In each case the number of independent experiments (from different mice) = 3 (but in each experiment >20 sections were examined; typically ∼1000–2000 cells in each experimental group). G–J, representative [Ca2+]i traces from PCSs in lobules from a control mouse (G, I) and a mouse with AP (H, J). In the control lobules (G, I), BK (1 nm) consistently evoked Ca2+ signals, whereas trypsin (10 nm) and the selective BK 1 receptor agonist Sar‐[DPhe8]‐des‐Arg8‐bradykinin (S‐BK) (1 μm) failed to do so. In the lobules isolated from mice with FAEE‐AP, BK (1 nm) failed to elicit Ca2+ signals, but trypsin (10 nm) and S‐BK (1 μm) were able to elicit such signals. K–M, quantitative evaluation of the change in PSC sensitivity to BK following induction of FAEE‐AP. K shows traces of BK‐elicited [Ca2+]i changes, all from one and the same PSC, in a control lobule, whereas L shows the results, from one and the same PSC, in a lobule from an FAAE‐AP mouse. The data from all experiments are summarized by the concentration–response curves in M (n = 6–10 for each point). N, comparisons of the responsiveness of PSCs to S‐BK (1 μm), thrombin (5 mU ml–1) and trypsin (10 nm) in control and FAEE‐AP lobules.
