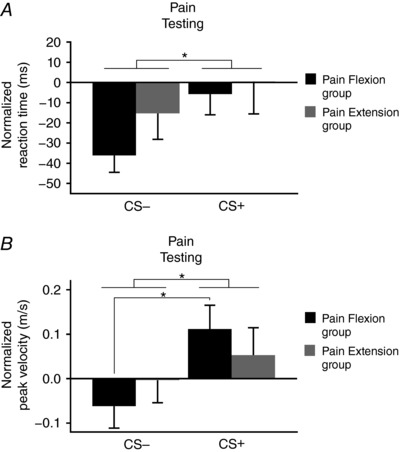
Figure 5. Mean (± SEM) change in reaction times and peak velocity for the Pain Testing phase normalized to the No‐Pain Testing phase for the two groups.

A, reaction time; B, peak velocity. CS+ = movement direction associated with pain; CS− = movement direction not associated with pain. * P < 0.05 for the comparisons indicated.
