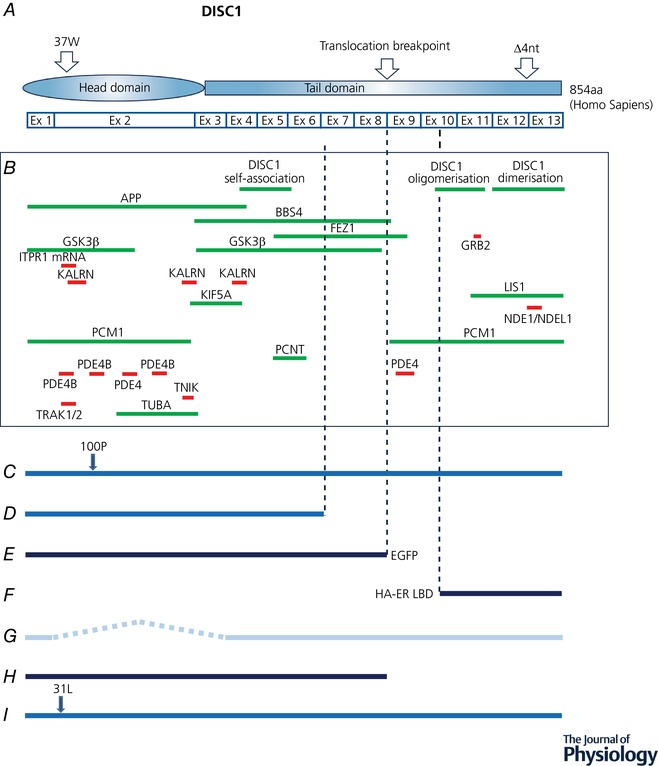
Figure 1. DISC1 protein–protein known interaction sites and DISC1 mouse mutants.

A, schematic representation of DISC1 human protein indicating naturally occurring mutation sites. 37W and the four‐nucleotide deletion in exon 12 are human mutations detected in psychiatric patients (Sachs et al. 2005; Song et al. 2008; Thomson et al. 2013). B, self‐association sites and sites required for partner binding/association. Fine‐mapped binding/association sites are indicated in red, and green indicates regions of DISC1 known to contain a site. See Table 1 for references to the original studies reporting the DISC1 protein interactions indicated here. C, endogenous mouse DISC1 carrying ethylnitrosourea‐induced point mutation (Clapcote et al. 2007). D, endogenous mouse DISC1 carrying targeted exon 8 stop codon and intron 8 polyA site plus a natural 25‐nucleotide deletion in exon 6; full‐length DISC1 expression is abolished (Koike et al. 2006). E, truncated mouse DISC1 with C‐terminal enhanced green fluorescent protein tag, expressed under native DISC1 promoter from transgenic bacterial artificial chromosome (Shen et al. 2008). F, inducible DISC1 expressed under a CAMKII promoter with N‐terminal mutant oestrogen receptor ligand binding domain fused to HA peptide tag (Li et al. 2007). G, endogenous mouse DISC1 exon 2/3 deletion; DISC1 expression is abolished (Kuroda et al. 2011). H, truncated human DISC1 cDNA inducibly expressed under cytomegalovirus (CMV) promoter with N‐terminal Myc peptide tag (Pletnikov et al. 2008) I, endogenous mouse DISC1 carrying ethylnitrosourea‐induced point mutation (Clapcote et al. 2007). J, human DISC1 cDNA carrying functional sequence variants, expressed under PrP promoter in rat. Four amino acid sequence changes are indicated; 607F and 704C are common human sequence variants (Trossbach et al., 2016). Dark blue lines indicate transgenic DISC1 expression against a background of endogenous expression; mid blue lines indicate modified endogenous expression; pale blue line indicates endogenous gene modification to abolish expression.
